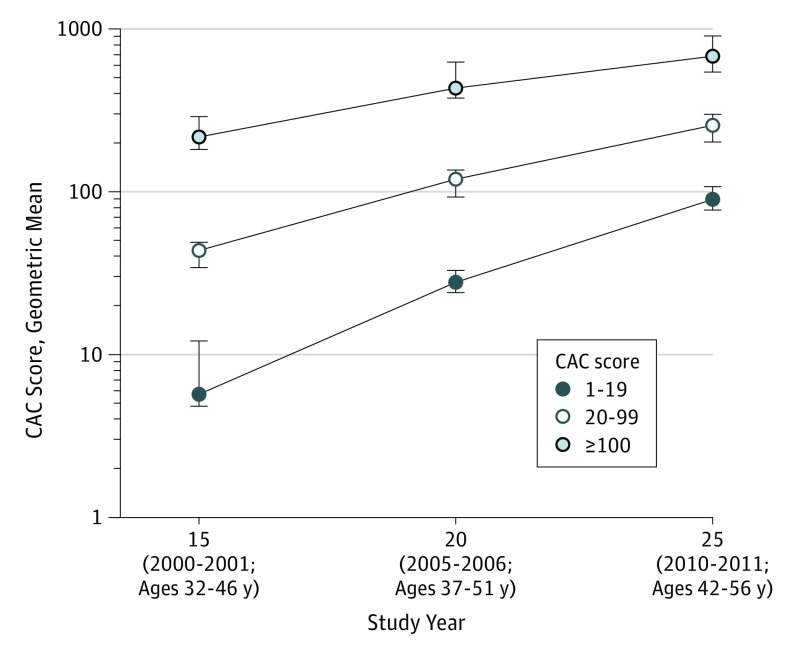
Figure 1. Individuals Aged 32 to 46 Years With Prevalent Coronary Artery Calcium (CAC) and Progression During the Following 10 Years.
The geometric means and 95% CIs by CAC score category at the year 15 examination (2000-2001), estimated in repeated measures regression with banded covariance structure, are presented. The geometric mean was used to address the skewness of the distribution and can be interpreted as comparable to the median of the distribution. Although CAC was initially minimal in the group with the lowest score (1-19), during the following 10 years the geometric mean CAC score increased from 5.7 at year 15 to 27.4 at year 20 to 89.8 at year 25. In the group with a score of 20-99, the geometric mean CAC score increased from 43.6 at year 15 to 117.8 at year 20 to 255.7 at year 25. In the group with a score of ≥100, the geometric mean CAC score increased from 217.2 at year 15 to 440.4 at year 20 to 680.0 at year 25. The linear increase observed, when plotted on the log scale y-axis, indicates exponential increase over time in the amount of CAC.

