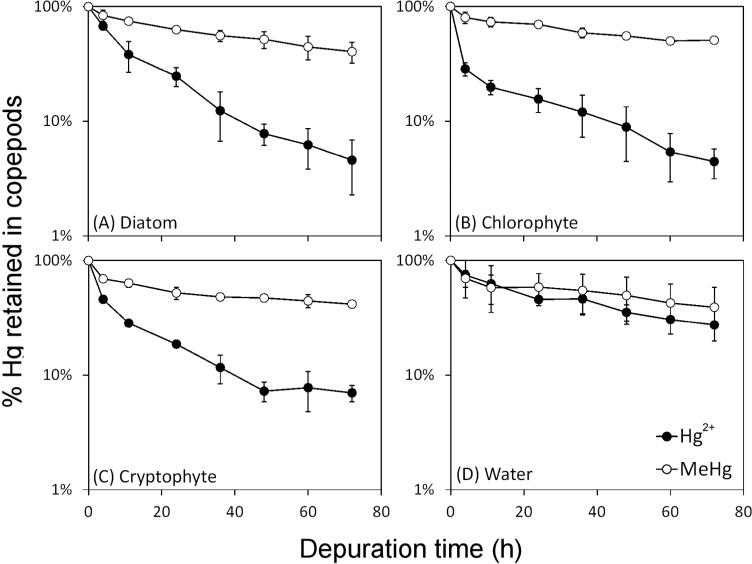
Figure 1.
Depuration curves of Hg2+ and MeHg in the copepod A. tonsa from all the experiments. Hg sources in (A) to (C) are different algal foods and (D) is the dissolved phase. Time zero represents the radioactivity measured immediately after feeding, which is assigned as 100%. In (A)-(C), radioactivity from controls (dissolved phase) were subtracted from radioactive measurements following feeding. Each point represents the average from three replicates and error bars denote 1 SD.

