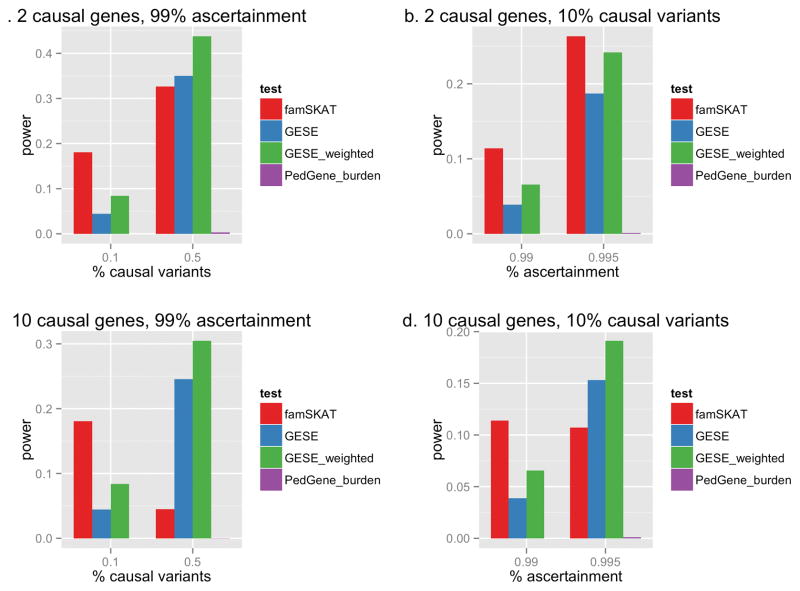
Figure 3. Power comparison for genes with 10 variants.
Power for genes each with 10 variants of interest at the LD level of ρ = 0.3 with 2 (a and b) or 10 (b and d) causal genes, showing the effect of increasing the percentage of causal variants (a and c) and increasing the ascertainment threshold (b and d).

