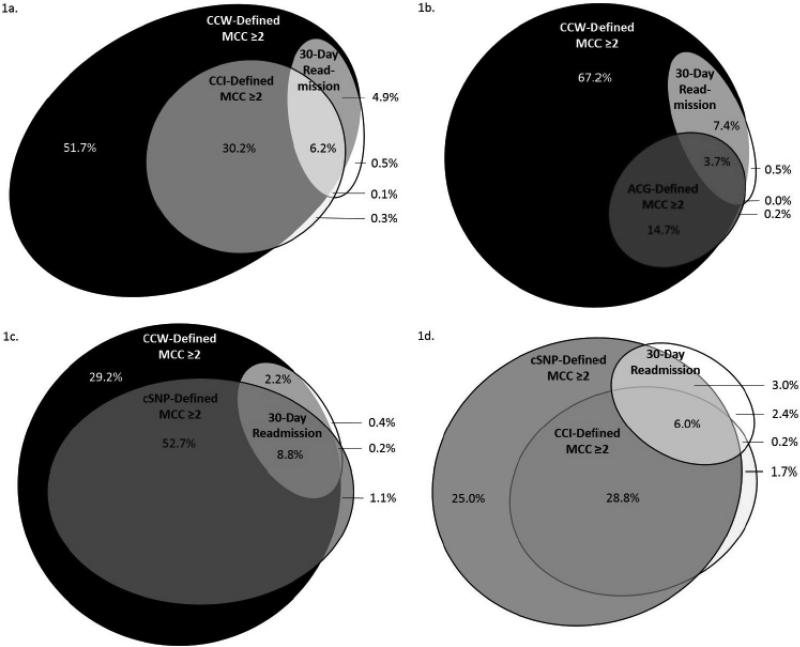
Figure 1 (grayscale). Venn Diagrams Illustrating Intersections between Different Definitions of Baseline Multiple Chronic Conditions (MCC) and Future 30-Day Hospital Readmission.
Chronic Condition Data Warehouse (CCW); Charlson Comorbidity Index (CCI); Johns Hopkins Adjusted Clinical Groups® (ACG®) Case-Mix System; Medicare Advantage Special Needs Plan Chronic Conditions (c-SNP). Percentages are with respect to the total population (n=710,609).
1a. Venn diagram illustrating the intersection of Medicare beneficiaries with multiple chronic conditions, as defined by CCW (black) and CCI (gray), with beneficiaries who experienced 30-day hospital readmissions (white).
1b. Venn diagram illustrating the intersection of Medicare beneficiaries with multiple chronic conditions, as defined by CCW (black) and ACG (gray), with beneficiaries who experienced 30-day hospital readmissions (white).
1c. Venn diagram illustrating the intersection of Medicare beneficiaries with multiple chronic conditions, as defined by CCW (black) and c-SNP (gray), with beneficiaries who experienced 30-day hospital readmissions (white).
1d. Venn diagram illustrating the intersection of Medicare beneficiaries with multiple chronic conditions, as defined by c-SNP (dark gray) and CCI (light gray), with beneficiaries who experienced 30-day hospital readmissions (white).

