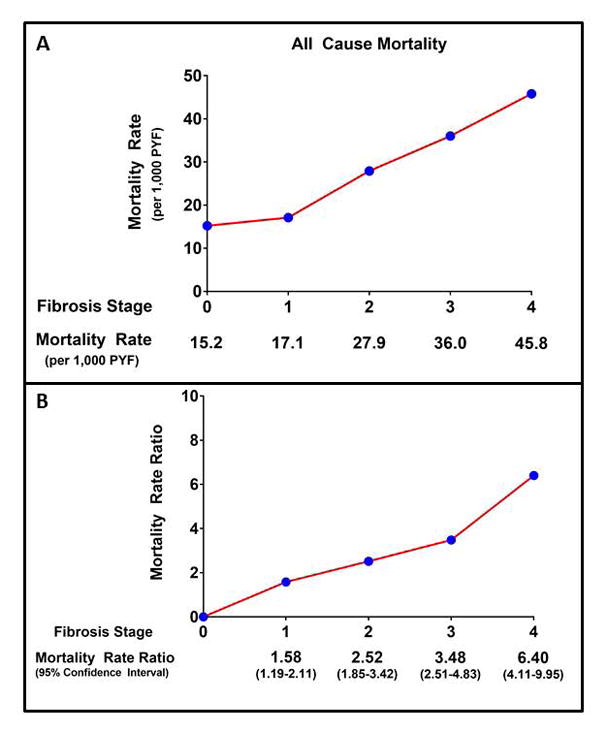
Figure 2. Fibrosis Stage Specific All-Cause Mortality Rate and Mortality Rate Ratio.

Panel A: Crude All-Cause Mortality Rate by Fibrosis Stage. Panel B: All-Cause Mortality Rate Ratio with 95% Confidence Intervals by Fibrosis Stage. PYF – patient years follow-up.
