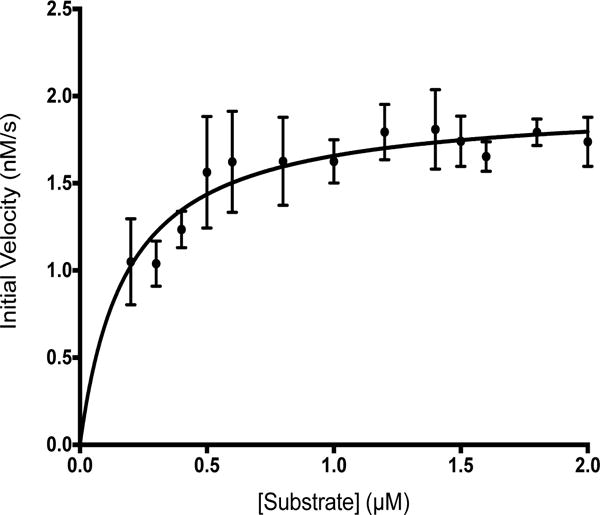
Figure 2. Michaelis-Menten plot of Prp kinetics.

The average initial velocity at each substrate concentration is plotted. Based on fits to non-linear regression equations for Michaelis-Menten kinetics and kcat, the vmax was 1.96 ± 0.06 nM/s, the Km was 0.18 ± 0.03 μM, kcat was 0.05 ± 0.00 s−1, and the specificity constant (kcat/Km) was 0.25 ± 0.04 μM−1s−1.
