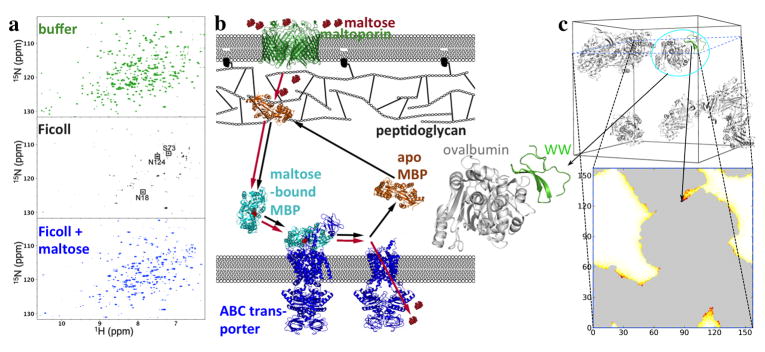
Fig. 3.
Nonrandom weak binding of the maltose-binding protein (MBP) and the Pin1 WW domain with bystander macromolecules. (a) Competition of Ficoll and maltose for interaction with MBP, shown by NMR spectroscopy. In buffer, apo MBP shows well-resolved 1H-15N TROSY spectra. With 200 g/l Ficoll, most of the TROSY peaks are broadened beyond detection, indicating MBP-Ficoll binding. Upon further addition of 1 mM maltose, the peaks are recovered, indicating that the ligand has competed out the weakly bound Ficoll. (b) Shuttling of MBP in the E. coli periplasm for transport of maltose into the cytoplasm. The apo form may be weakly bound to the outer membrane-attached peptidoglycan; upon binding maltose, MBP is released from the peptidoglycan and diffuses toward the inner membrane, where it hands over the ligand to the ABC transporter for translocation into the cytoplasm. Red and black arrows indicate the flow of maltose and the shuttling of MBP, respectively. (a)and (b) taken from [12]. (c) Protein-crowder interaction energies calculated by FMAP. Top panel: the test protein (green) is the Pin1 WW protein, and the crowder is ovalbumin, with 8 copies present in a cubic box with a 157.4-Å side length (corresponding to a concentration of approximately 150 mg/mL). The crowder configuration was a snapshot taken from molecular dynamics simulation in explicit solvent. Note that the crowder molecules formed clusters. Bottom panel: in the FMAP calculation, both the protein and crowder molecules were represented at the all-atom level, and the energy function consisted of Lennard-Jones terms for modeling steric, van der Waals, and hydrophobic interactions and Debye-Hu ckel terms for modeling electrostatic interactions [73]. The energy map on a slice through the crowder box is shown according to a color scale from white to dark red; the gray regions are occupied by the crowder molecules. The placement of the test protein shown in the top panel has the minimum interaction energy, in which the substrate recognition site of the WW domain forms close contacts with one of the ovalbumin molecules (enlarged view on the left).

