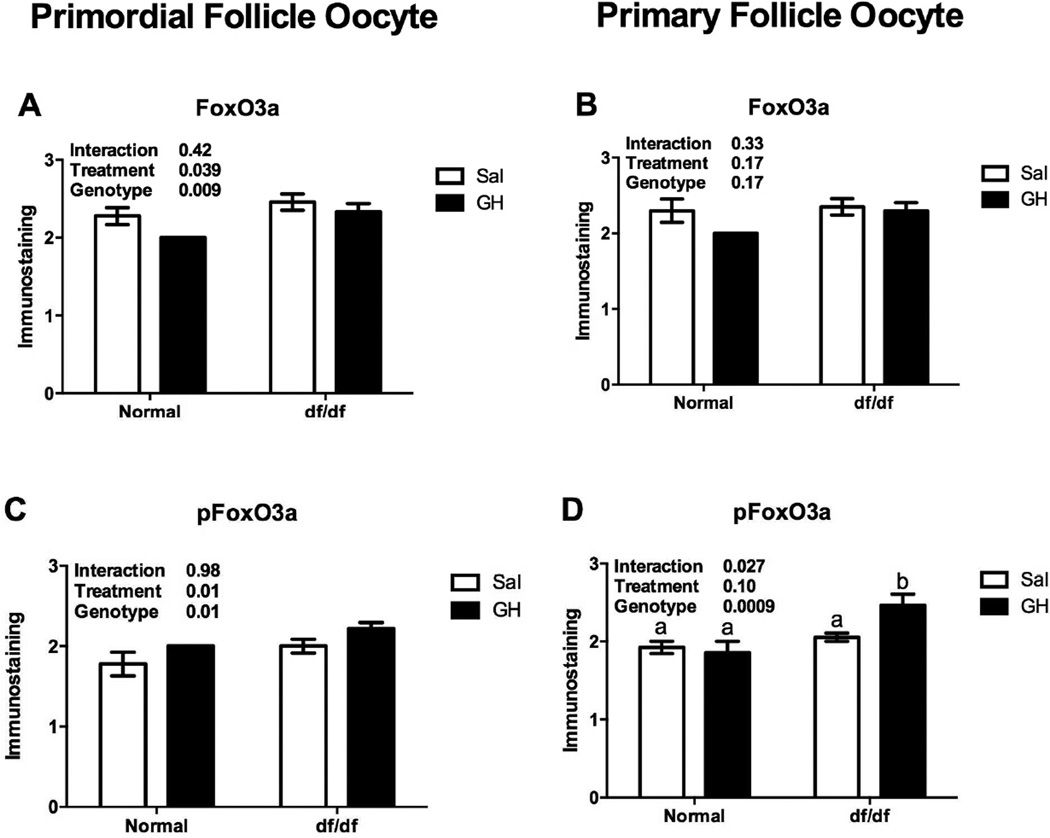
Figure 3.
Immunostaining for FoxO3a (A and B) and pFoxO3a (C and D) in oocytes from primordial/transitional and primary follicles in Ames dwarf (df/df) and Normal (N/df) mice receiving GH or saline treatment (n=18 oocytes/category/group). Different letters indicate significant differences when the interaction was significant (P<0.05). The initial values were converted to a scale from 0 (no staining) to 4 (intense staining).

