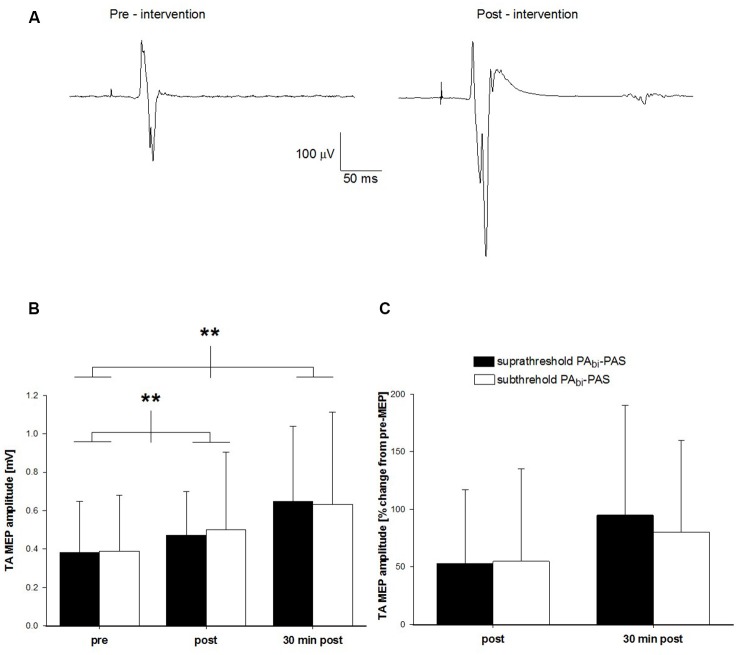
Figure 4.
Change in TA MEP amplitude after subthreshold PAbi-PAS compared to suprathreshold PAbi-PAS at rest. (A) TA MEP changes prior to and following the subthreshold PAbi-PAS intervention for one participant. Data are the average of 16 trials. (B) TA MEP changes in mV, prior to, immediately following, and 30 min post suprathreshold PAbi-PAS compared to subthreshold PAbi-PAS intervention (n = 10). Across both interventions, MEPs were significantly increased immediately after PAS (p = 0.028) and 30 min after PAS (p = 0.002) compared to before PAS. (C) TA MEP immediately following, and 30 min post suprathreshold PAbi-PAS and subthreshold PAbi-PAS interventions expressed as a percent change from values prior to the intervention. Asterisks in (B,C) denote significant differences. Error bars represent standard deviation.

