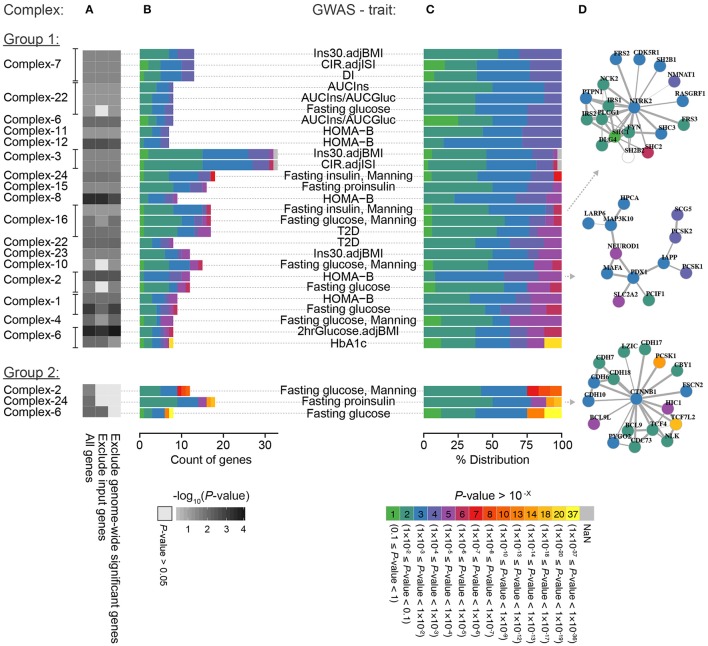
Figure 4.
Breakdown of significantly enriched complex-trait combinations. (A) The enrichment of GWAS signals for each of the 30 significant complex-trait combinations when including all genes, excluding input genes, and excluding genes with genome-wide significant association in the given GWAS (see Section Methods for details). The genes in each complex-trait combination are colored based on P-value (i.e., minimum P-value for the SNPs mapping to the respective gene) partitioned into factor-10 groups; (B) actual count and (C) percentage distribution of gene P-values within a complex in the GWAS for the given glycemic trait. (D) Example of complexes.

