Figure 2.
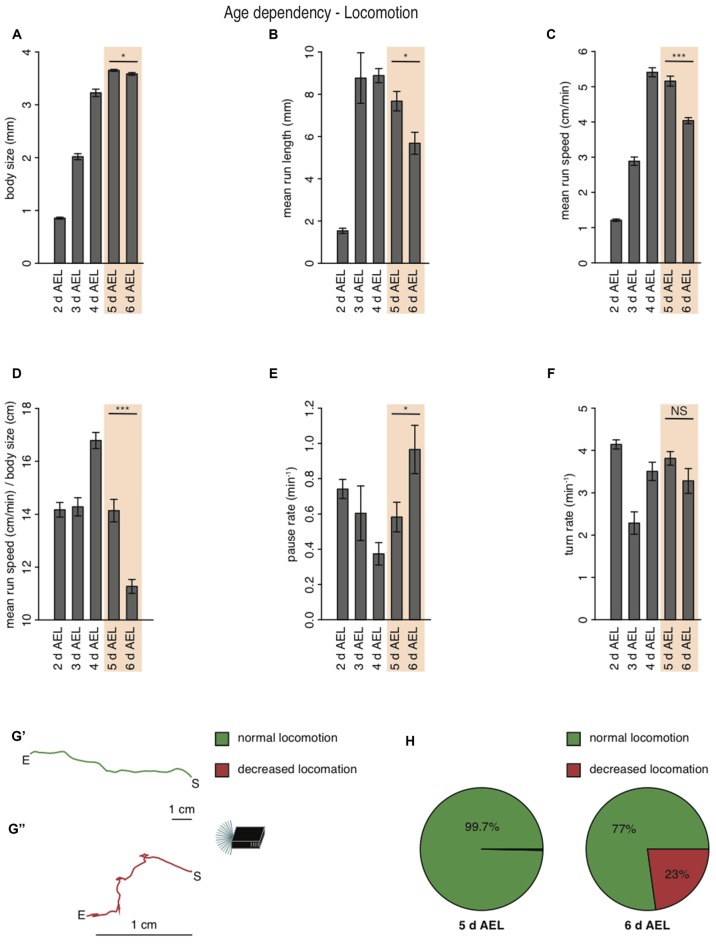
Larval locomotion is changing with larval body size and age. (A) Mean body size of different larval age groups. Mean run length (B), mean run speed (C) and the calculated ratio of mean run speed to body size (D) of different larval age groups. Pause rate (E) and turn rate (F) per min of the different aged larval groups. (A–F) Data show the mean and error bars indicate ± SEM. Rejection of the null hypothesis that the data set of two groups have the same mean: *p < 0.05, ***p < 0.001, unpaired t test. (G) Two representative larval tracks of larvae corresponding to the age 6 days AEL. A larval track consists of all runs and turns the respective larvae is performing during the whole experiment. One track belongs to the category “normal locomotion” (G′), whereas the other track belongs to the category “decreased locomotion” (G″). “S” indicates the starting and “E” the end point of the respective larval track. Decreased locomotion was defined as loss of the ability to leave a virtual circle with 5 cm in diameter throughout the experiment. (H) Pie chart showing the percentage of larvae showing normal (green) and decreased (red) locomotion for larvae of age 5 and 6 days AEL.

