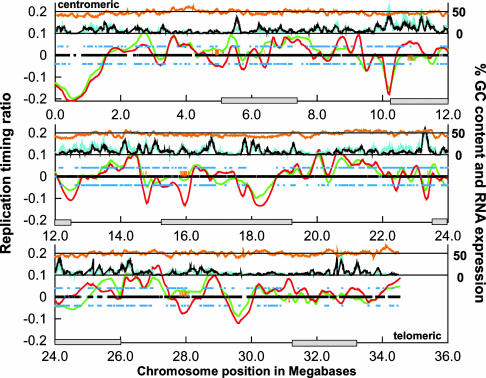
Fig. 4.
DNA replication profiles for HFL-1 and NC-NC. DNA replication-timing ratios (log2-transformed) were plotted according to chromosomal position. Shown is the nonrepetitive part of chromosome 22 extending from the centromere (Upper Left) to the telomere of the q arm (Lower Right). Data were smoothed by loess smoothing, and the best-fit plots are shown for HFL-1 (green line) and NC-NC (red line). The black mark along the baseline indicates regions of DNA replication timing that were present on the microarray and compared between both cell types. Associated orange hash marks indicate regions of significant difference (P < 0.05) in DNA replication timing. The percentage of chromosomal GC content is plotted as an orange line near the top of the plot as a sliding 100-kb window. The percentage of transcribed sequences for both cell types is plotted just below GC content as a sliding 100-kb window along the chromosome for HFL-1 (cyan line) and NC-NC (black line). Annotated genes that are expressed in HFL-1 and NC-NC are indicated as blue squares above (HFL-1) and below (NC-NC) the baseline. Locations of cytological G bands are indicated by gray boxes along the chromosome-position axis (22). (A larger version of this figure is available at http://array.mbb.yale.edu/chr22.)

