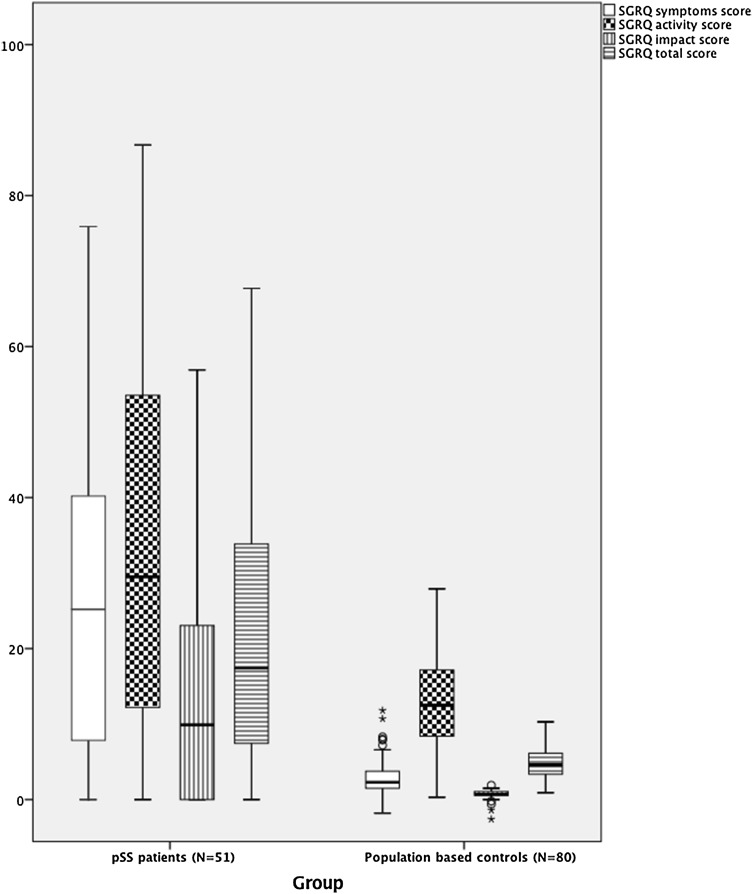
Fig. 1.
Results of the St George’s Respiratory Questionnaire (SGRQ) in pSS patients and expected values based on the results from population based controls. The horizontal line in the middle of the box represents the median value and the height of the box the interquartile range (IQR). The horizontal bars below and above the box define the range

