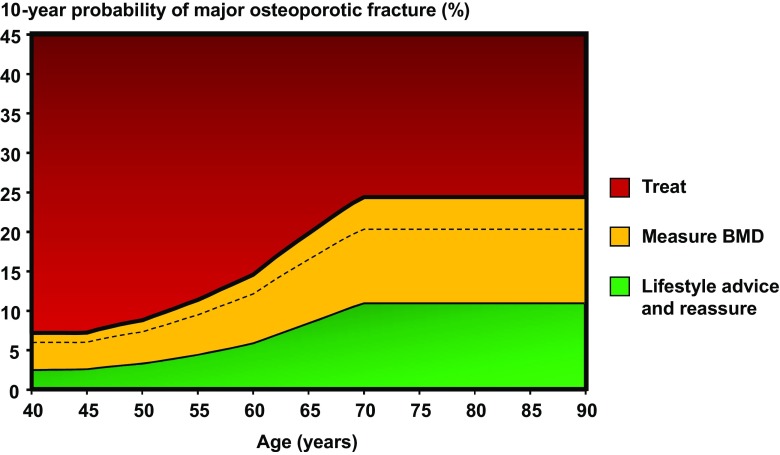
Fig. 2.
Graph showing assessment and intervention thresholds in the UK for major osteoporotic fracture probability. The dotted line represents the intervention threshold while the assessment thresholds are shown within the amber area [141]. BPs bisphosphonates, GCs glucocorticoids

