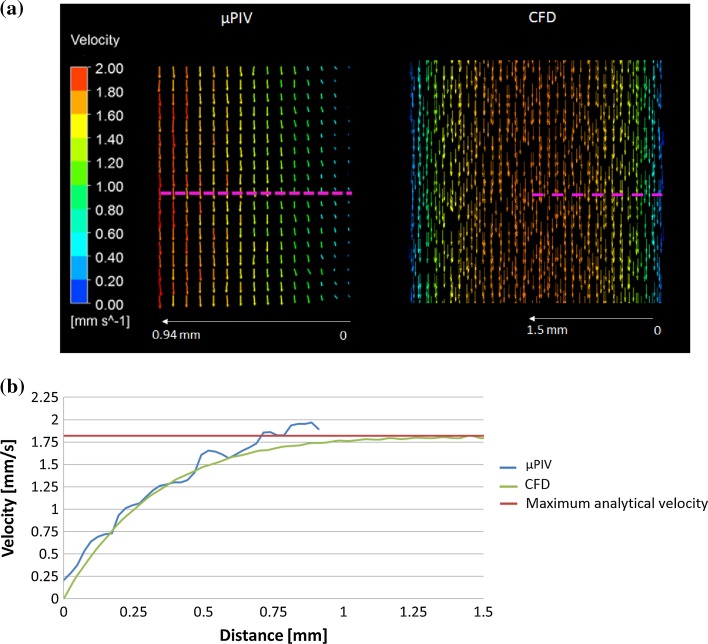
Figure 4.
(a) Velocity vectors from a plane located in the middle of the rectangular channel calculated using µPIV (left) and CFD (right) methods. The pink dotted lines show from where the velocity values were extracted to compare both techniques quantitatively. (b) The blue line and green lines represent the velocity values extracted from the profiles shown in (a) for the µPIV and CFD tools, respectively. The red line is the maximum fluid velocity calculated analytically that can be reached inside the rectangular channel.

