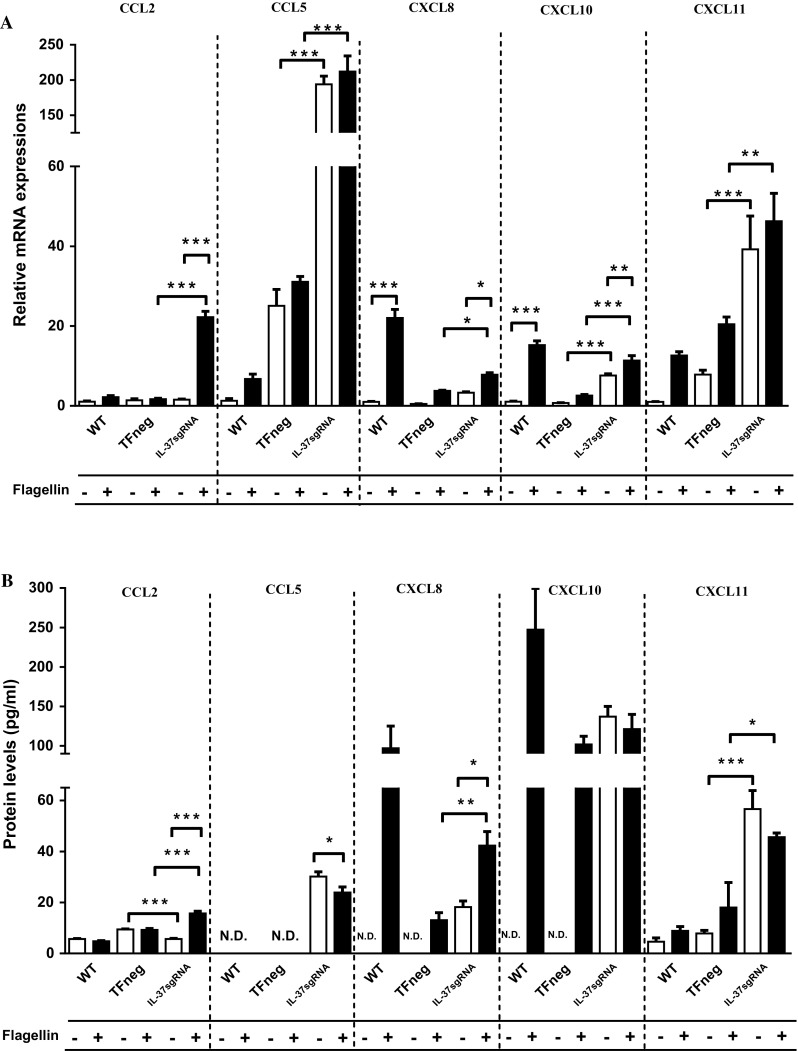
Fig. 3.

mRNA (a) and protein (b) levels of CCL2, CCL5, CXCL8, CXCL10, and CXCL11 (n = 5). The filled bars represent cells stimulated with 100 ng/ml flagellin for 12 h, whereas empty bars denote unstimulated cells. First, unstimulated cells with reduced IL-37 levels (IL-37sgRNA) were compared to unstimulated cells transfected with an empty plasmid (TFneg), whereas the IL-37sgRNA cells stimulated with flagellin are compared to TFneg cells stimulated with flagellin. Second, unstimulated cells are compared to flagellin-stimulated cells, within the same cell type (WT, TFneg or IL-37sgRNA). Statistically significant differences are marked with *, **, or *** depicting p < 0.05, < 0.01, or < 0.001. All data are shown as mean ± SEM. WT wild-type T84 cells, N.D not detected
