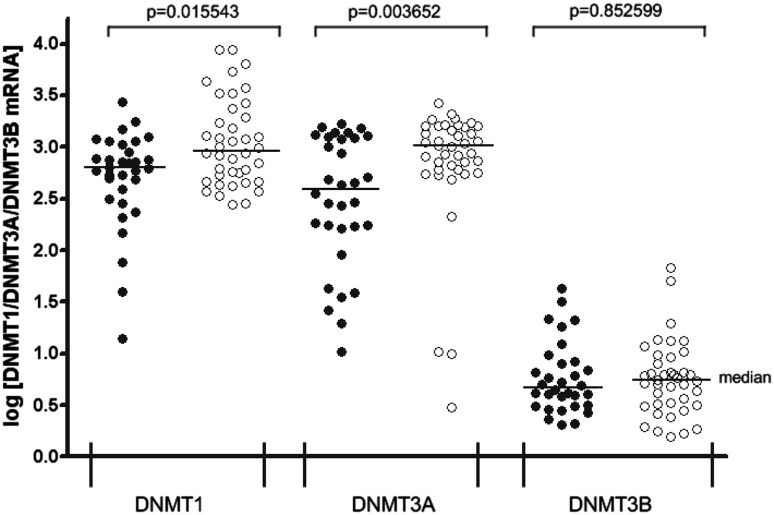
Fig. 2.
DNMT1, DNMT3A, and DNMT3B transcript levels in peripheral blood mononuclear cells (PBMCs) from patients with diagnosed SLE and control group. PBMCs from SLE patients (n = 32, filled circles) and controls (n = 40, open circles) were used for RNA isolation. Total RNA was reverse-transcribed, and cDNAs were investigated by RT-qPCR relative quantification analysis. The DNMT1, DNMT3A, and DNMT3B mRNA levels were corrected by PBGD level. The amounts of DNMT1, DNMT3A, and DNMT3B mRNA were expressed as the decimal logarithm of multiples of these cDNA copies in the calibrator

