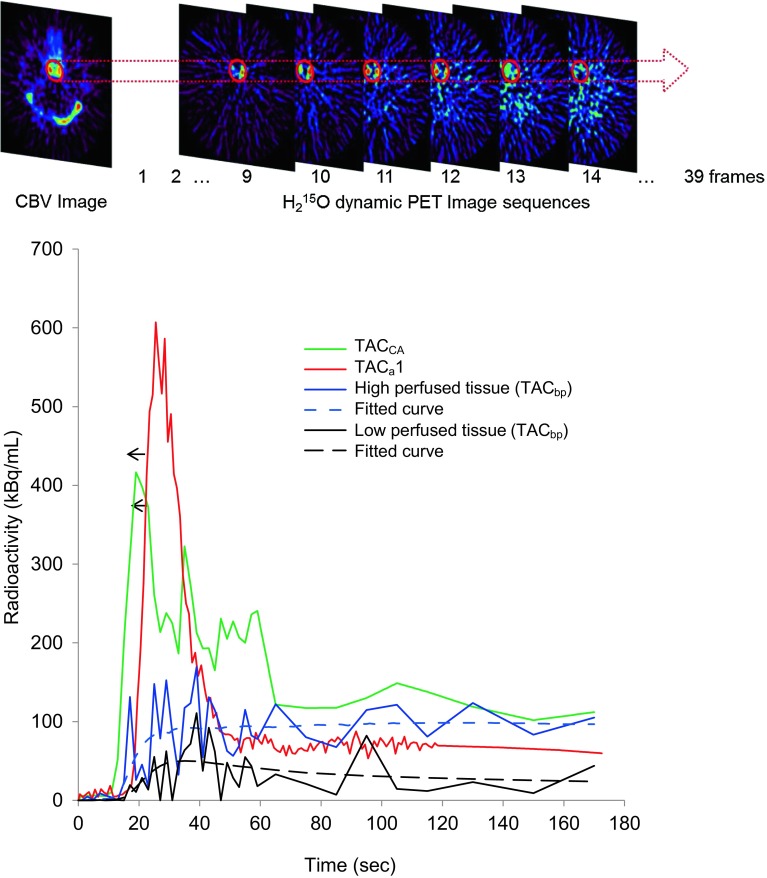
Fig. 2.
Upper Scheme showing the region of interest (ROI) for ICA TAC and its application to the dynamic PET data. Bottom Representative TACs from arterial blood sampling (TACa1, red line), ROI peak value in the ICA region (TACCA, green line) and the regional pixel value in the high and low perfused brain tissue (TACbp, blue and black solid lines, respectively). Blue and black dotted lines (fitted curve) show a result of non-linear least squares fitting of the arterial input after delay and dispersion correction for each TACbp. The arrow shows the direction of delay correction to adjust the initial slope of TACa1 to TACCA. In cases of a long delay time, the difference between TACa1 and TACCA was greater than 10 s

