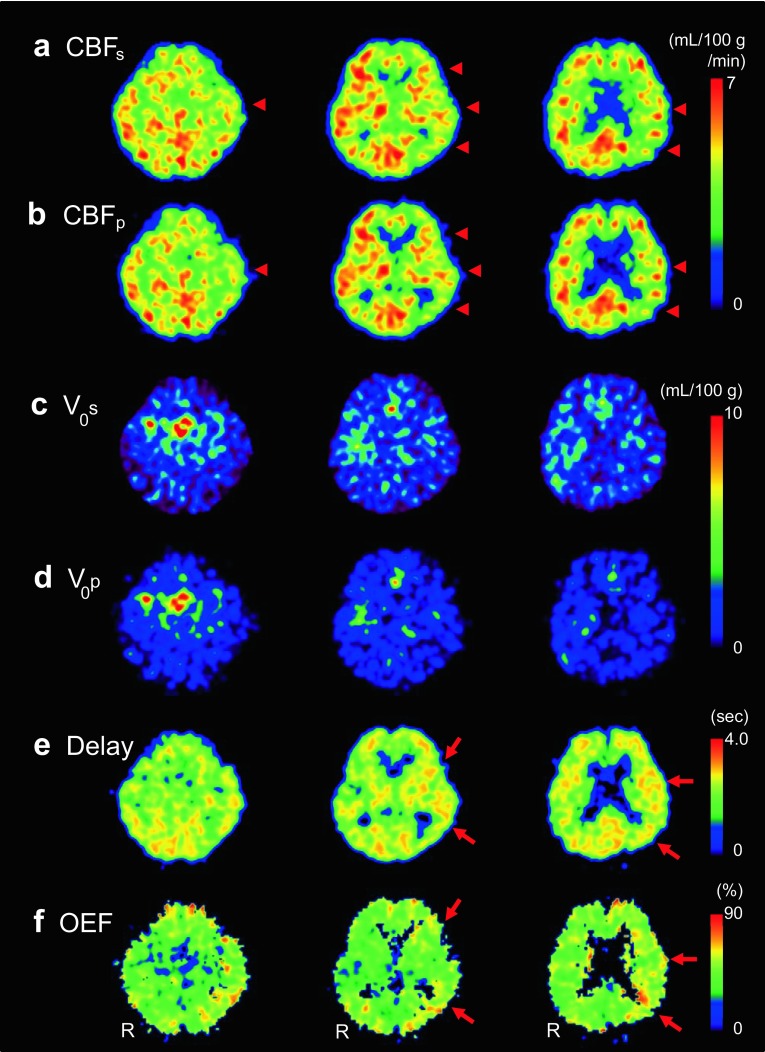
Fig. 3.
Images from a representative case with left ICA stenosis (R at the bottom of each column shows right side of the patient): Baseline CBF images calculated by slice-by-slice a and pixel-by-pixel b delay correction show a CBF decrease in left MCA territory. Arrowheads indicate CBF decrease in the affected side. CBF values were very close between the two methods. Baseline V 0 images obtained by slice-by-slice c and pixel-by-pixel d delay correction show a significant difference in quantitative values between the two methods (2.08 vs. 1.27 mL/100 g in the global V 0 mean). Asymmetry indexes (% difference between the hemispheres) were 78 and 72% for slice-by-slice and pixel-by-pixel methods, respectively. A delay image e from the pixel-by-pixel method shows a longer delay time in the left hemisphere in accordance with the OEF elevation (f) (arrows)

