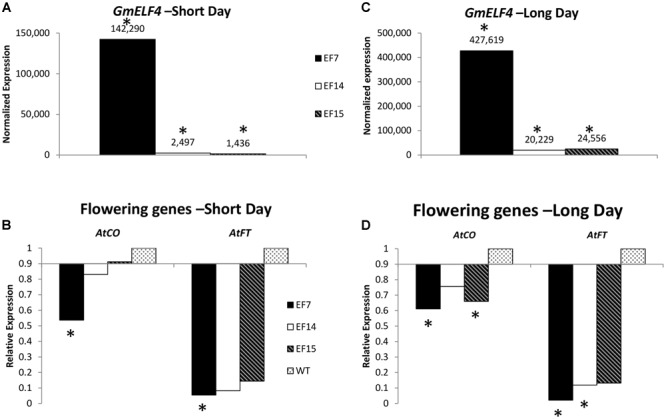
FIGURE 4.

Gene expression profile by RT-qPCR. The expression of GmELF4 (A) and of the flowering genes AtFT and AtCO (B) was evaluated in under short conditions. (C,D) Show the expression of GmELF4 and the flowering genes (AtFT and AtCO) under long day conditions. Leaves of the transgenic lines (EF7, EF14, and EF15) were evaluated at ZT8. Relative expression was calculated using the Rest2009 software package (Pfaffl et al., 2002) using the Arabidopsis endogenous gene PP2A for expression normalization. Wild-type (WT) plants expression was used for AtFT and AtCO expression calibration (B,D). Asterisks indicate statistically significant changes in gene expression, as calculated by Rest2009.
