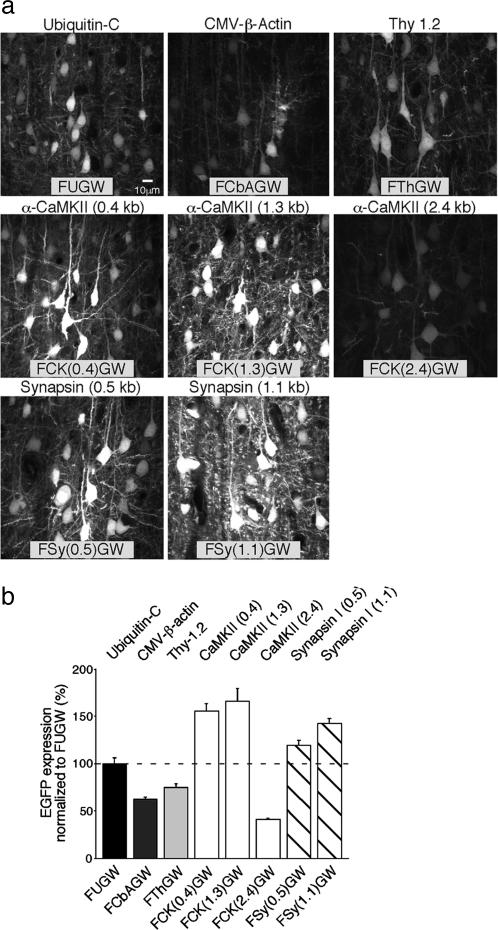
Fig. 1.
Lentivirus-based EGFP expression in cortical neurons in vivo: P21–P28 infection. (a) Examples of lentivirus infected layer 2/3 neurons in the somatosensory cortex. The internal promoter types and corresponding vector names are indicated at the top and bottom of each image, respectively. The images are maximum-intensity projections of five z sections separated by 1.0 μm, collected by confocal microscopy from the outer region of the injection sites (within 100 μm from the periphery of an injection area of a 500- to 600-μm diameter) in brain sections. [Scale bar, 10 μm (Left Upper) is valid for all images.] (b) Quantification of EGFP expression based on fluorescent signal within nuclei of individual infected neurons (n = number of cells analyzed). The promoter types and corresponding vector names are indicated above and below the bar graphs, respectively. The values (percent mean ± SEM) are normalized to FUGW expression: FUGW = 100 ± 6.9, n = 69; FCbAGW = 62.7 ±1.8, n = 13; FThGW = 74.8 ± 3.9, n = 19; FCK(0.4)GW = 155.1 ± 7.9, n = 20; FCK(1.3)GW = 165.7 ± 13.5, n = 41; FCK(2.4)GW = 41.1 ± 1.0, n = 30; FSy(0.5)GW = 142.5 ± 4.7, n = 20; FSy(1.1)GW = 119.4 ± 5.2, n = 20.

