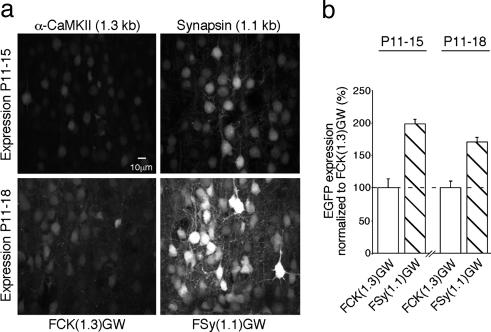
Fig. 2.
Lentivirus-based EGFP expression in cortical neurons in vivo: P11 to P15/18 infection. (a) Examples of infected layer 2/3 neurons in the somatosensory cortex, as in Fig. 1a. The infection period is indicated on the left. (b) Quantification of EGFP expression normalized to FCK(1.3)GW expression, as in Fig. 1. The infection period is indicated above the bar graphs. P11–P15: FCK(1.3)GW = 100 ± 13.6, n = 10; FSy(1.1)GW = 197.9 ± 7.1, n = 10; P11-P18: FCK(1.3)GW = 100 ± 10.3, n = 8; FSy(1.1)GW = 170.4 ± 6.9, n = 13.

