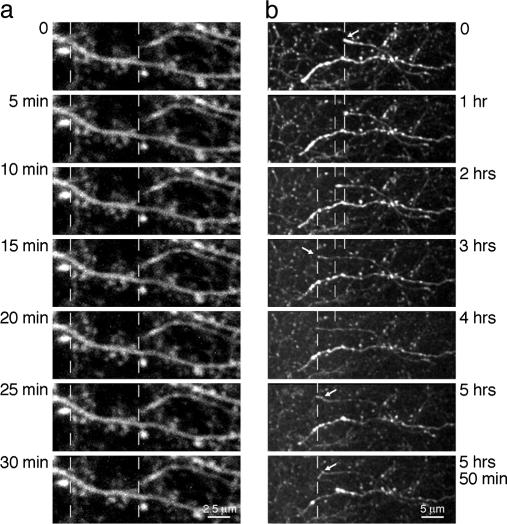
Fig. 4.
Two-photon time-lapse imaging of dendritic spines and axonal projections in the mouse cortex. Acquisition times are indicated on the sides of each image. Each image is a maximum-intensity projection of image stacks (z step, 1 μm) collected in cortical layer 1 in vivo (infected neurons were located in layer 2/3). Dashed vertical lines serve as a guide for comparison of structures over time. (a) Imaging of dendritic spines caused no photobleaching after 30 min at a 1-min sampling interval, with ▵F(t = 30 min) ≈0.97·▵F(t = 0min). (b) Imaging of axons in a layer 1 region adjacent to the injection site for >5 h at a 5-min sampling interval, with ▵F(t = 300 min) ≈0.66·▵F(t = 0 min). Some axonal projection endings, an example indicated by an arrow, showed directed outgrowth for several micrometers on a time scale of several hours in young animals (P15–P17 mice). Note the different scale bars in a and b.

