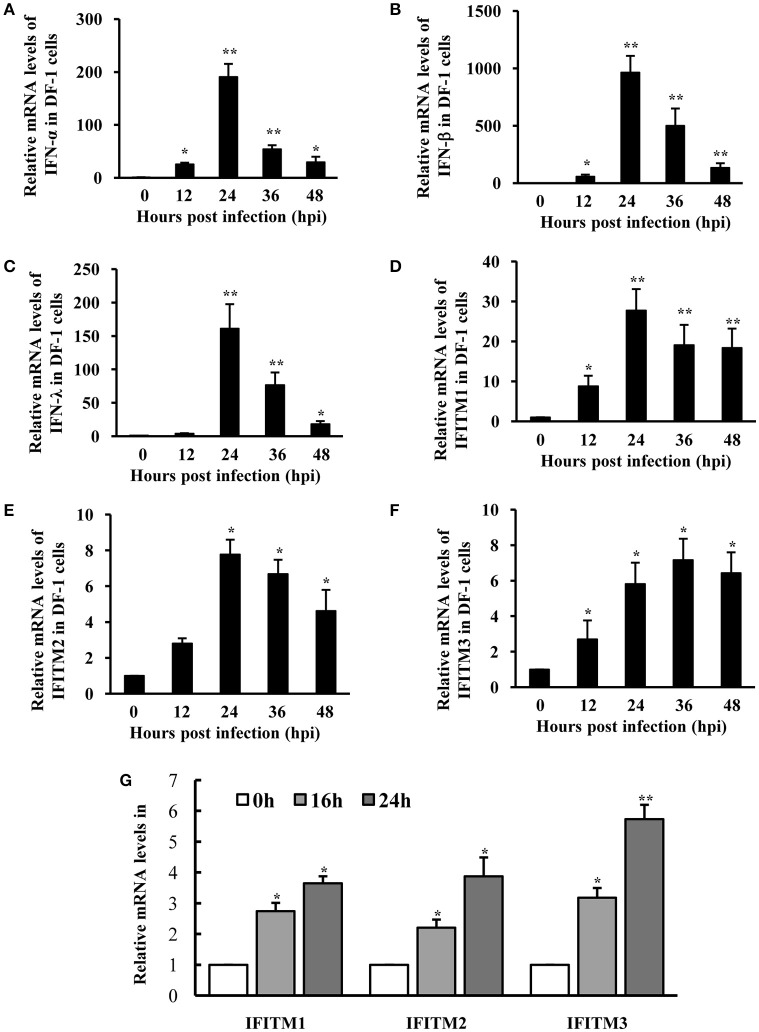
Figure 4.
IFITMs are significantly induced in DF-1 cells after ATMUV infection or treatment with IFN. DF-1 cells were infected with or without ATMUV at a MOI of 1.0 and harvested at 0, 12, 24, 36, and 48 hpi, respectively. qRT-PCR was performed to determine the relative mRNA expression of indicated IFNs (A–C) and IFITM (D–F) genes compared with that at 0 hpi. (G) DF-1 cells were treated with chicken IFNs (500 IU/mL) for 0, 16, or 24 h. qRT-PCR was performed to determine the relative mRNA expression of IFITM genes compared with that without IFN treatment. The mRNA levels were normalized to the endogenous β-actin level. Plotted are the average levels from three independent experiments with three replicates per experiment (means ± SD). Statistical significance was determined by one tail Student's t-test analysis. *P < 0.05, **P < 0.01.

