Figure 7.
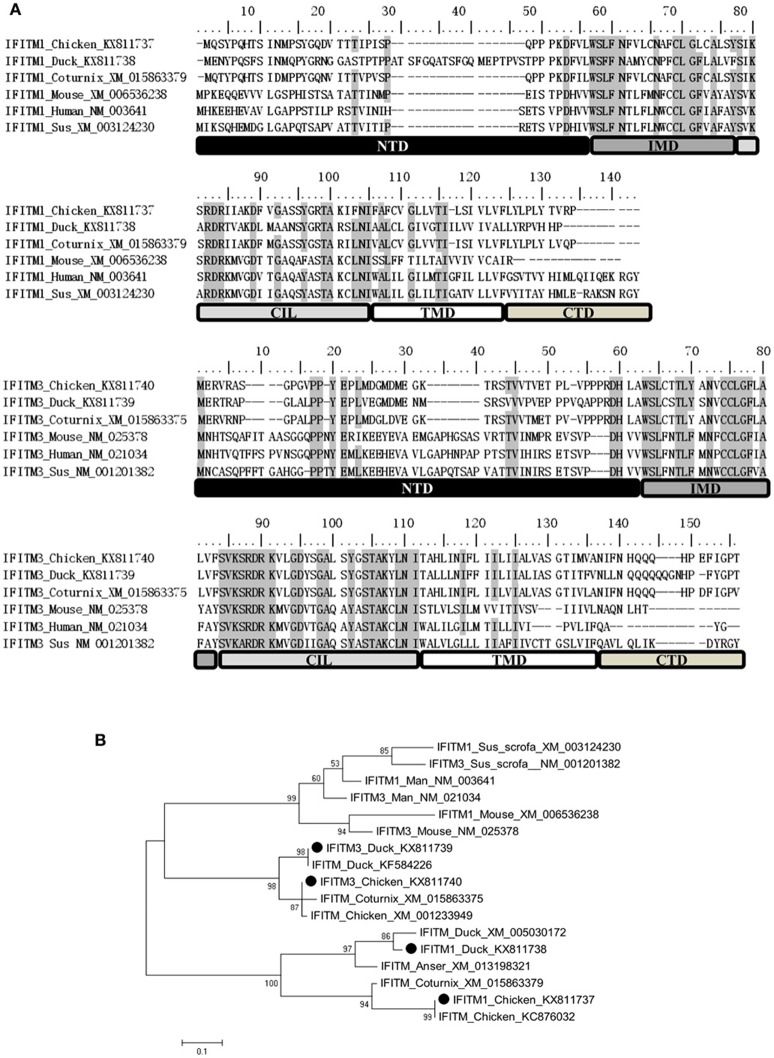
Analysis of chicken and duck IFITM1 and IFITM3 proteins. (A) IFITM sequences were aligned using MUSCLE software. Five domains in each sequence alignment were highlighted with different colors: N-terminal domain (NTD), intramembrane domain (IMD), conserved intracellular loop (CIL), transmembrane domain (TMD), and C-terminal domain (CTD). Gray background indicated amino acid identity. (B) A maximum-likelihood tree was generated between chicken/duck IFITM1, 3 amino acid sequences, and other species using MEGA 5.0 software. Bootstrap analysis was performed with 1000 trials. Black circle (•): chicken/duck IFITM1, 3 amino acid sequences deposited in the Genbank database with accession numbers by our lab.

