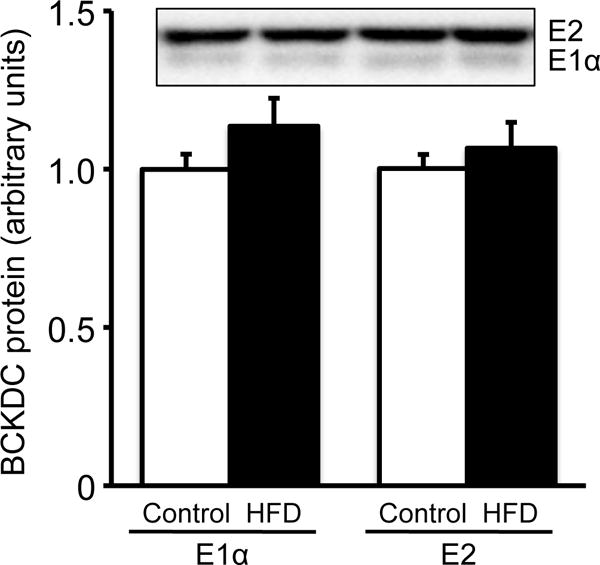
Fig. 3. Amount of BCKDC subunits in liver extracts of male rats fed a 60% of kcal HFD or control diet for 12 weeks.

Abundance of BCKDC subunits (E1α and E2) was measured by Western blotting. The same amount of proteins (25 μg) of the liver extracts were applied on each lane of Western blotting. Band intensities are presented relative to the mean values of control diet group. Typical images of Western blots are shown above each bar. Values are means ± SE, n=7/treatment. #P<0.05 vs. control diet group.
