Figure 1.

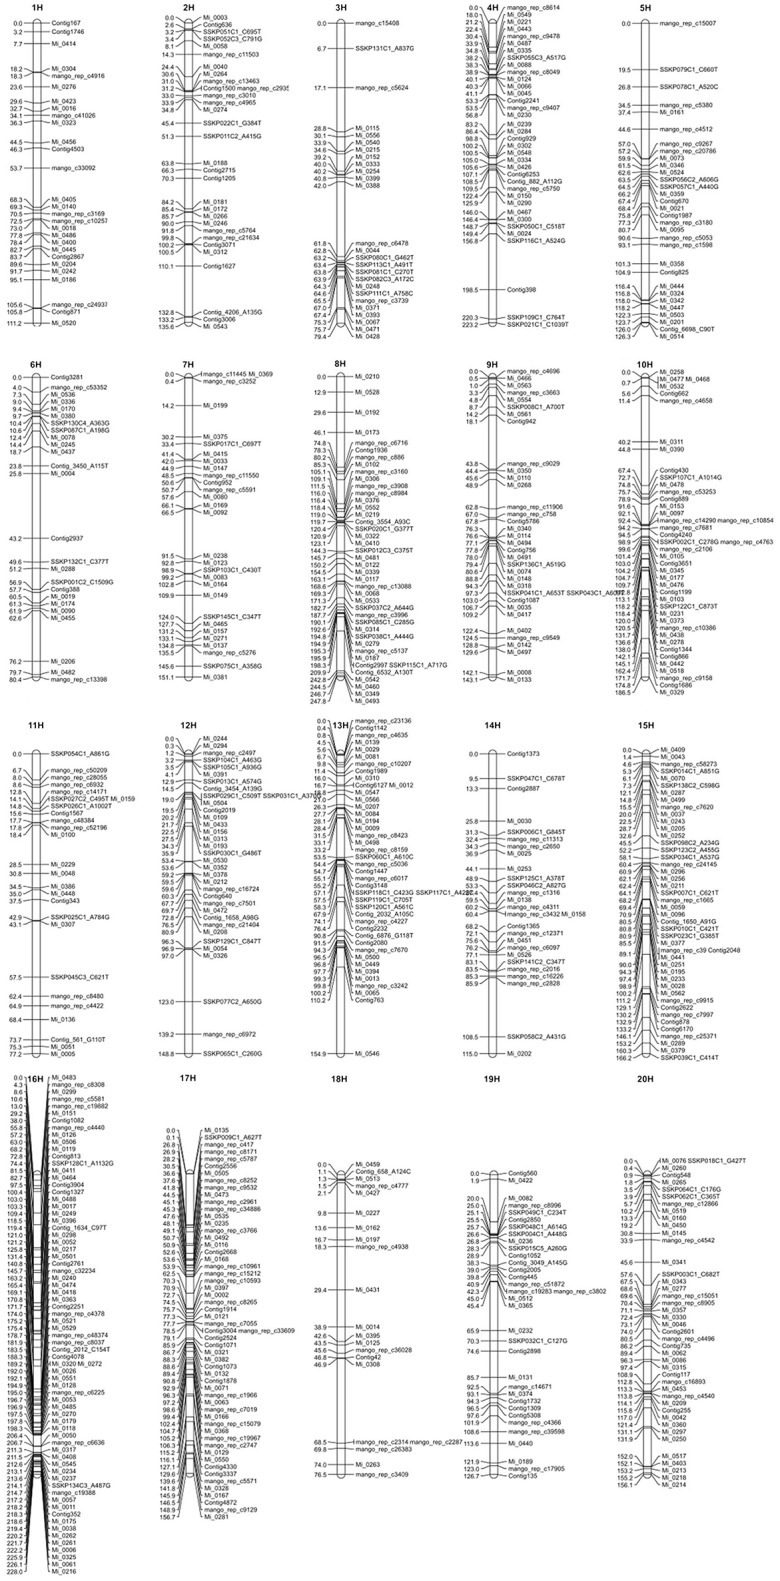
The consensus genetic map of mango. Vertical lines represent linkage groups. Horizontal lines crossing the vertical lines depict the name and position in cM of SNP markers on the linkage group.

The consensus genetic map of mango. Vertical lines represent linkage groups. Horizontal lines crossing the vertical lines depict the name and position in cM of SNP markers on the linkage group.