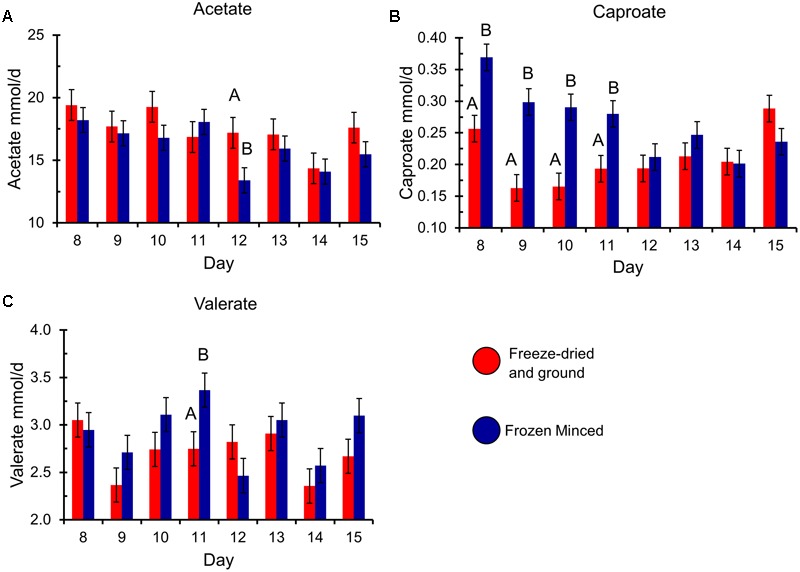
FIGURE 1.

Production of the volatile fatty acids (A) acetate, (B) caproate, and (C) valerate, by experimental day and forage preparation type. Error bars represent standard error of the mean. Forage preparation types that significantly differ (P < 0.05) within each experimental day are indicated by different uppercase letters.
