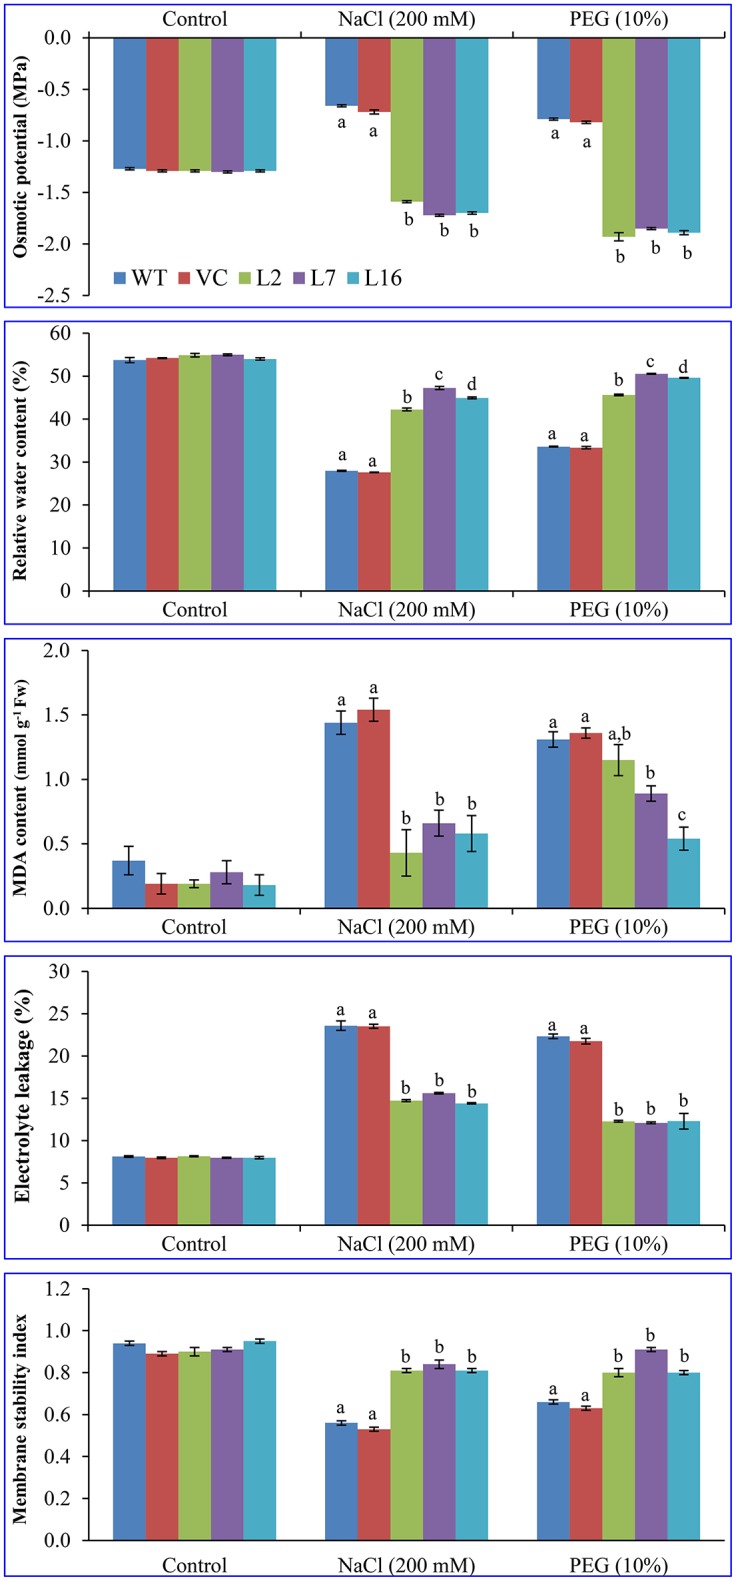
Figure 4.

Physiological analyses of transgenic lines. Estimation of osmotic potential (OP), relative water content (RWC), lipid peroxidation (MDA content), electrolyte leakage (EL), and membrane stability index (MSI) from leaves of control plants (WT and VC) and transgenic lines (L2, L7, and L16) under control, salinity and osmotic stress conditions. Bars represent means ± SE and values with different letters are significant at P < 0.05.
