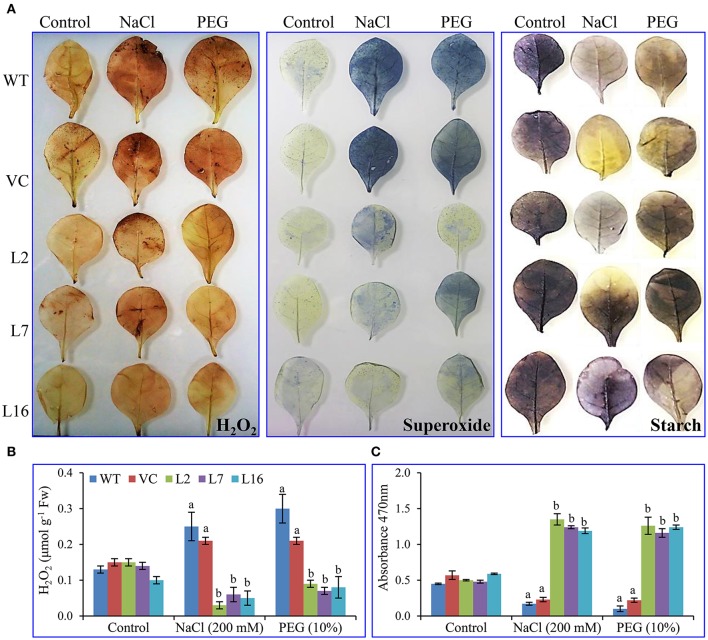
Figure 6.
In vivo localization and cell viability. (A) In vivo localization of H2O2, superoxide and starch, estimation of (B) H2O2 content and (C) superoxide radicals of transgenic (L2, L7, and L16) and control (WT and VC) leaves. Bars represent means ± SE and values with different letters are significant at P < 0.05.

