
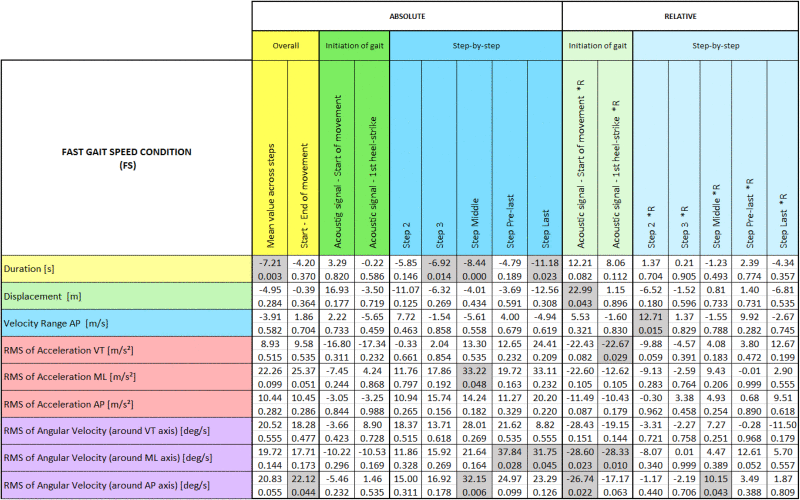
Table 3.
Results of kinematic parameters for the fast gait speed condition (FS). The top number in each cell is the mean percentage of differences, calculated as the mean value for outcomes from PDg minus mean value for outcomes from the HCg, relative to the mean value for outcomes from the HCg. The bottom number is the corresponding p value for the difference (all parameters with p < 0.05 are marked with a grey background). Note that the results corresponding to kinematic parameters relative to the mean value across steps are marked with *R.
|