
Figure 4.
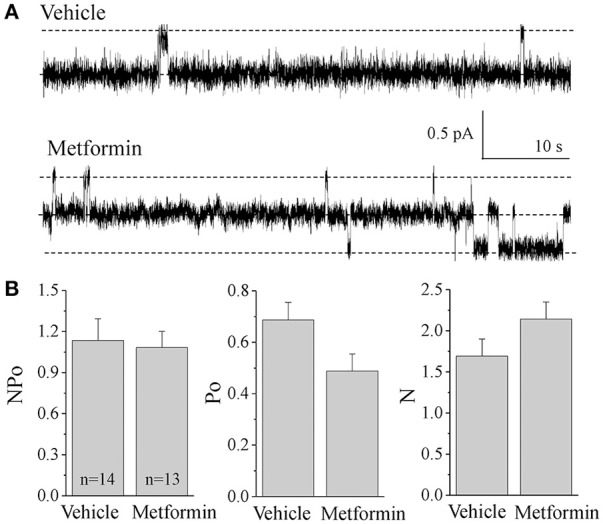
ENaC activity in cortical collecting ducts of vehicle- and metformin-infused animals. (A) Representative current traces for ENaC activity measured in cell attached patches from freshly isolated CCDs. Rats were fed with 8% salt diet and treated with either vehicle (N = 3) or metformin (N = 5). Holding potential was –40 mV. (B) Summary graph of observed ENaC activity (NPo), open probability (Po) of individual channels and number of channels (N) in the patches.