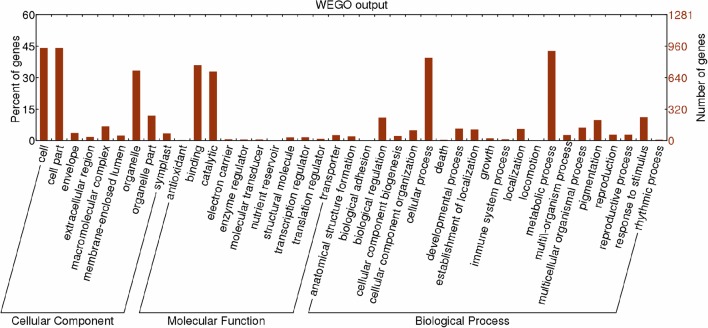
Figure 8.
Functional classification of targets of known miRNAs according to Gene Ontology (GO) categories. Enriched GO data were plotted using WEGO (http://wego.genomics.org.cn/cgi-bin/wego/index.pl). The left Y-axis represents the percentages of targets of known miRNAs in each main category. The right Y-axis indicates the numbers of targets of known miRNAs in each GO category.

