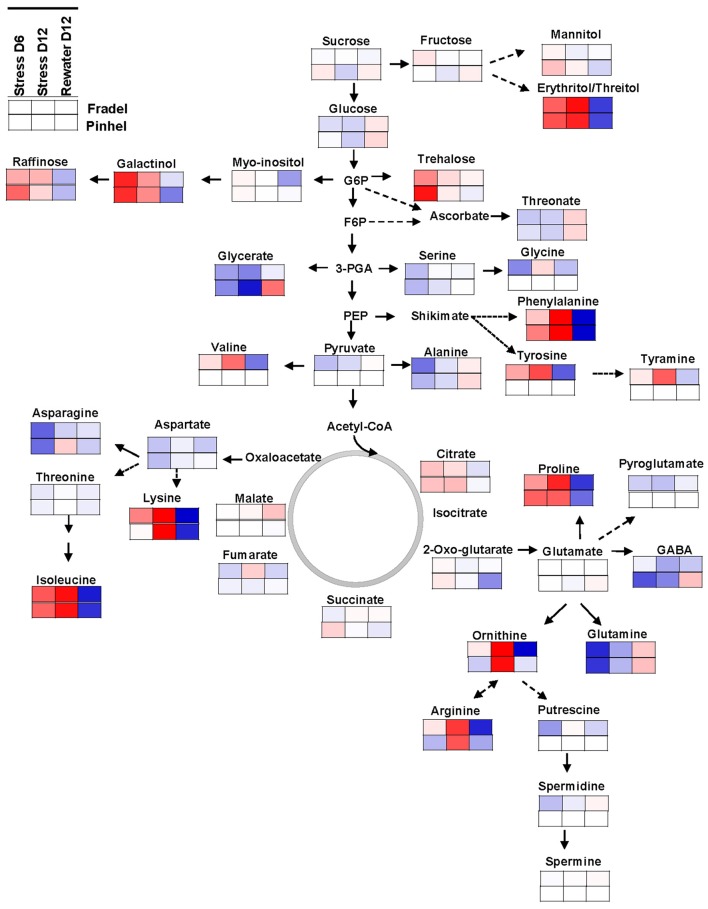
Figure 10.
Mapping of leaf metabolites in representative pathways. Metabolites are visualized using the averaged log fold-change ratios (n = 4 to 6) between drought-stressed and well-watered plants harvested at day 6 and 12, and between rewatered and drought-stressed plants harvested at day 12. Fradel = top row cells; Pinhel = bottom row cells. Red and blue indicate increased and decreased levels, respectively.

