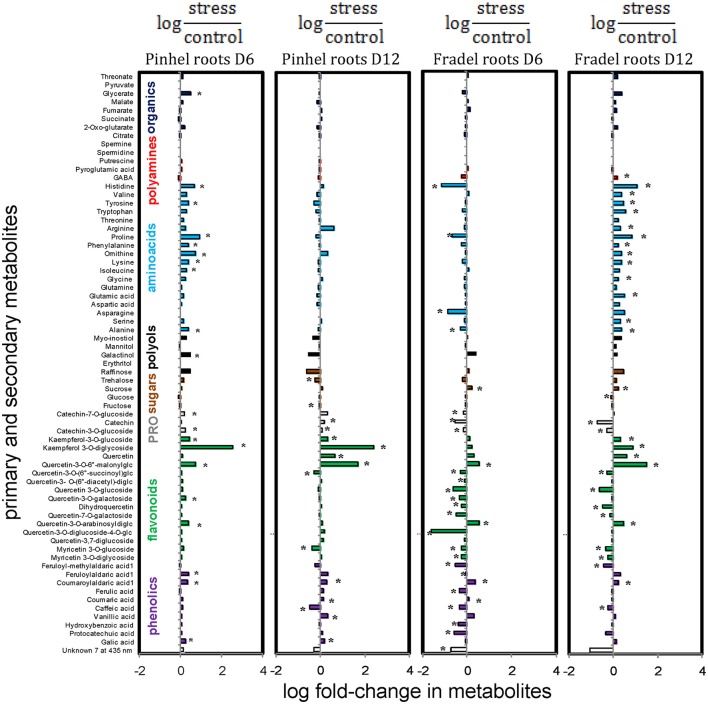
Figure 11.
Effects of drought stress on cowpea root metabolites. Data are presented as averaged logarithmic fold-change ratios of metabolite levels in drought-stressed and control plants. Unidentified and undetected metabolites (with the exception of unknown7) are omitted for visual clarity. PRO = proanthocyanidins. Measurements were taken on day 6 (D6) or 12 (D12) of water stress (n = 4–6). Negative values represent reduced and positive values increased metabolite content in the stressed plants, with asterisks indicating statistical differences (t-test; P < 0.05).

