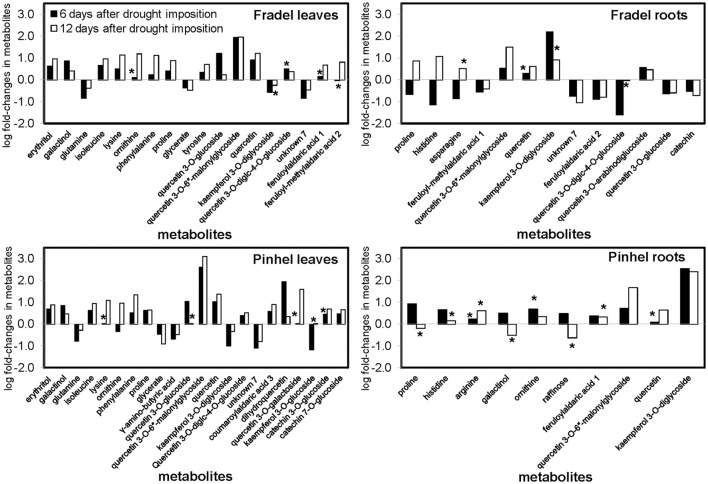
Figure 3.
Comparison of metabolite changes in cowpea in response to 6 and 12 days of drought stress. Log fold-changes were determined relative to the control. Only metabolites that showed at least a 0.5-fold change at day 6 or day 12 are displayed. Metabolites marked with * were not statistically different between well-watered and drought-stressed conditions (t-test, P < 0.05).

