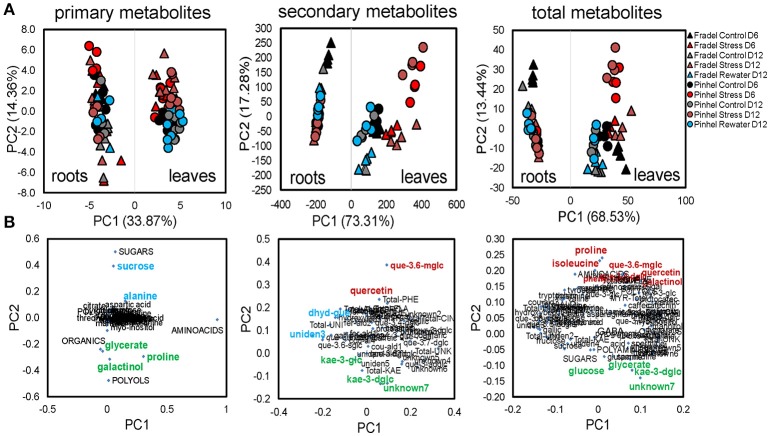
Figure 6.
PCA of metabolic differences among well-watered control, drought-stressed, and rewatered cowpea plants. Shown are 104 variables: 41 GC-MS primary metabolites + 5 categories, and 35 LC-DAD secondary and 12 unidentified metabolites + 11 categories (n = 4–6). Data were square root-transformed with pareto scaling. (A) PCA scores with treatments as indicated in the legend. (B) Highest positive and negative loadings (Supplementary Table 6) associated with metabolic responses to stress/rewatering are tagged in red and green, respectively. Loadings associated with other factors, e.g., sampling time, cultivar, or organ, are highlighted in blue. Metabolites were grouped according to functional categories, indicated in capital letters. The complete names of secondary metabolites can be retrieved from Supplementary Table 3.

