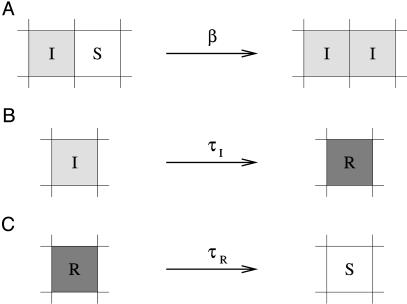
Fig. 1.
Representation of processes in the contact network model. (A) Infection. Infected hosts (I) can infect susceptible (S) neighbors with infection rate β. The total probability of infection is 1 – eiβΔt, where i is the number of infected neighbors. (B) Acquisition of resistance. Hosts are infectious for a fixed period τI, after which they become resistant (R). (C) Loss of resistance. After a fixed period τR, resistant hosts once again become susceptible.

