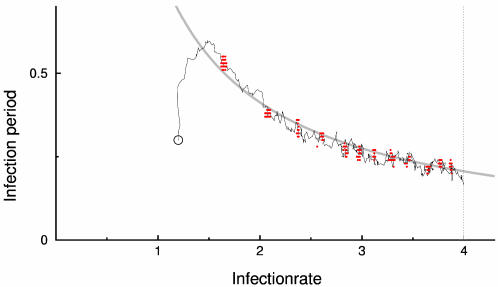
Fig. 4.
Evolutionary dynamics. The evolutionary trajectory (black line) represents the change in the population's mean infection rate and infection period over time (same as Fig. 3). Point clouds represent all pathogen types present in the 120 × 120 grid at one time. The point clouds are plotted every 5,000 time units to give an indication of the temporal dynamics of the evolutionary process. During evolution, pathogen diversity is low; typically only two and three step mutants are present. Relaxation to the R0 = 6.6 emergent trade-off line (gray line) is relatively fast, whereas progression along the line is much slower. This result occurs because, along the trade-off, traveling waves are relatively stable, slowing down the spread of new genetic information through the system.

