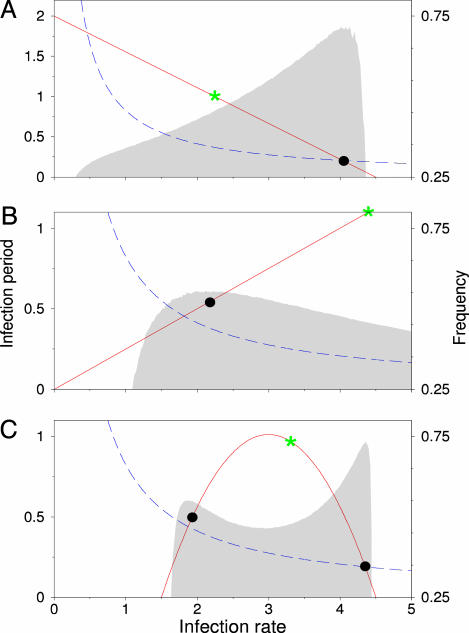
Fig. 6.
Evolutionary optimization along explicit trade-offs. Red lines represent trade-offs, i.e., combinations of infection rate and infection period to which evolution is constrained. Green stars indicate maximal number of secondary infections (i.e., maximal R0). Black dots indicate the endpoint of evolutionary simulations. Outbreak frequency is indicated by the gray shaded area. The emergent trade-off at R0 = 6.6 is shown by a blue dashed line. (A) Evolution along a linear trade-off between infection rate and infection period leads to evolutionary optimization close to maximum outbreak frequency. (B) Selection for outbreak frequency can limit evolution for increased infection rate and infection period, even when these traits are positively correlated. (C) Nonlinear trade-off curves that result in multiple local frequency optima give rise to alternatively stable evolutionary attractors. Results shown are for a 120 × 120 grid.

