
Figure 2.
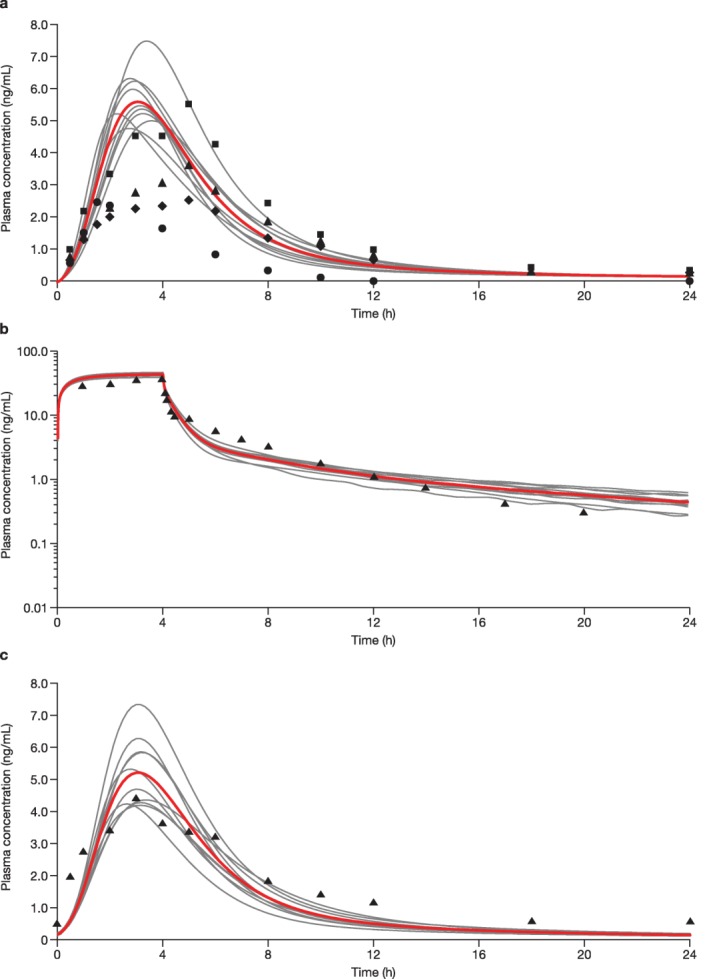
Simulated and observed rosuvastatin plasma concentration‐time profiles of rosuvastatin in healthy subjects after oral administration of (a) a single 10‐mg dose of rosuvastatin, (b) a single 8‐mg i.v. infusion, and (c) a 10‐mg once‐daily dosing for 14 days. (a) Ten trials were simulated with 15 healthy volunteers/trial (20% women; age, 19–65 years). Curves represent the simulated mean rosuvastatin profiles for the individual simulated trials with the overall mean shown in red; circles, diamonds, triangles, and squares represent the observed means from four studies. (b) Ten trials were simulated with 10 healthy volunteers/trial (20% women; age, 19–55 years). Curves represent the simulated mean rosuvastatin profiles for the individual simulated trials with the overall mean shown in red; triangles represent the observed mean from the absolute bioavailability study by Martin et al.20 2003. (c) Ten trials were simulated with 24 healthy volunteers/trial (10% women; age, 19–60 years). Curves represent the simulated mean rosuvastatin profiles for the individual simulated trials with the overall mean shown in red; triangles represent the observed mean from the pharmacokinetic/pharmacodynamic study by Martin et al.31 2002.