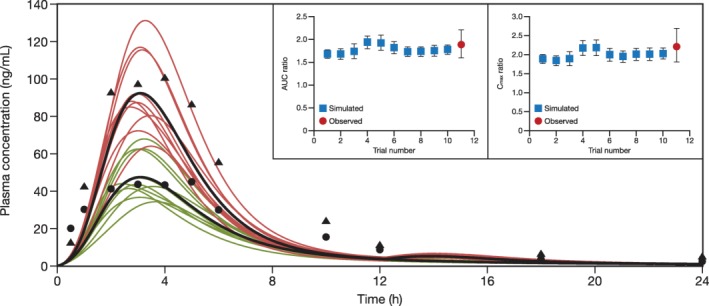
Figure 5.

Simulated and observed plasma concentration‐time profile of a single 80‐mg dose of rosuvastatin when administered in the presence or absence of gemfibrozil 600 mg twice daily. Ten trials were simulated with 20 healthy subjects/trial (15% women; age, 19–55 years). Curves in black represent the mean rosuvastatin profiles for the simulation trials. Red curves indicate the presence of gemfibrozil. Green curves denote the absence of gemfibrozil. Black triangles represent observed concentrations of rosuvastatin in the presence of gemfibrozil. Black circles represent observed concentrations of rosuvastatin in the absence of gemfibrozil from Schneck et al.30 in 2004. Inset panels show simulated vs. observed area under the curve (AUC) and maximum concentration (Cmax) ratios of rosuvastatin in the presence of gemfibrozil. Error bars in the inset represent 90% confidence intervals.
