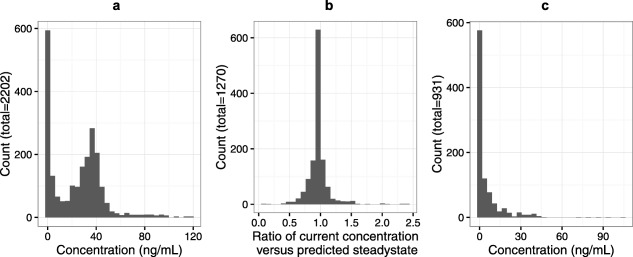
Figure 2.

(a) A histogram of all morphine concentrations. (b) A histogram of the ratio between the predicted morphine concentration and the predicted morphine steady state at the time of pain assessment. (c) A histogram of morphine concentrations when pain was assessed but no infusion was ongoing (placebo group, for whom morphine rescue analgesia was allowed).
