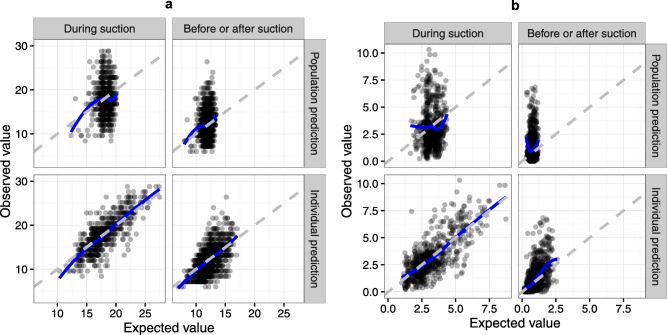
Figure 4.

Observed vs. predicted plot for COMFORT‐B (a) and visual analogue scale (VAS) (b) with population predictions in the upper rows and individual predictions in the lower rows. The gray dashed line is the line of unity and solid blue line is local regression smoothing. Because the pain levels were almost identical before and after suctioning, these two states were combined within this plot. To correct for the missing item “muscle tension,” the observed and predicted sums of the existing items were multiplied by 6/5 to arrive at the total COMFORT‐B score.
