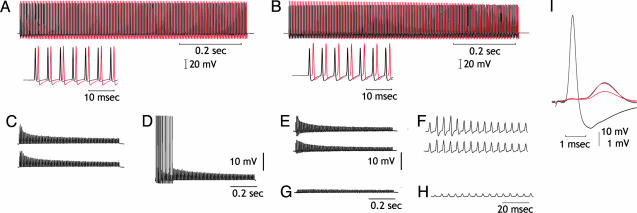
Fig. 2.
Effect of intracellular C2B IgG injection in transmitter availability. (A and B) Upper traces, simultaneous presynaptic (black) and postsynaptic (red) recordings after repetitive presynaptic stimulation at 200 Hz. Lower traces are as above at higher sweep speed. (C) Control, the stimulus trains are repeated until all post spikes fail (upper trace). Trains are repeated every 5 sec until all spikes fail at the first stimulus train after 5-sec pause (lower trace). (D) After 15 min, stimulus train demonstrates recovery from transmitter depletion. (E) The same as in C but after IgG injection. (F) Postsynaptic potentials shown at higher gain and sweep speed to show detail time course. (G) Transmission after 15-min rest interval, demonstrating further reduction of transmitter release. (H) The same as in G but at a higher sweep speed. (I) Detailed comparison of the last synaptic potential in F (upper trace) and H to show amplitude reduction but no change in synaptic time course as the smaller potential is enlarged (red) to the amplitude of the potential in F (black).

