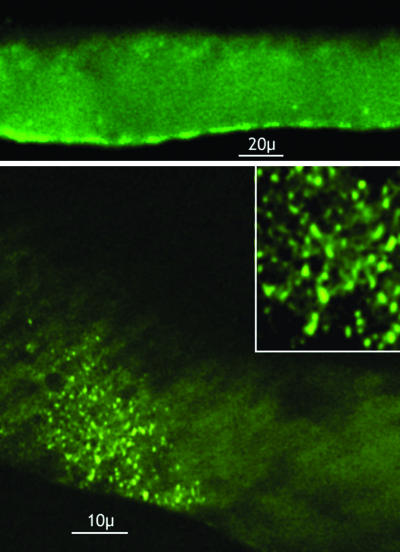
Fig. 4.
Presynaptic localization of fluorescent labeled anti-mSyt I-C2B IgG by using two-photon laser-scanning microscopy. (Upper) Low-magnification image showing membrane distribution of the fluorescent label. (Lower and Inset) En phase imaging of the presynaptic membrane, demonstrating the membrane bound distribution of label. Note the distribution corresponds to the size and geometrical distribution of the synaptic active zones in the terminal.

