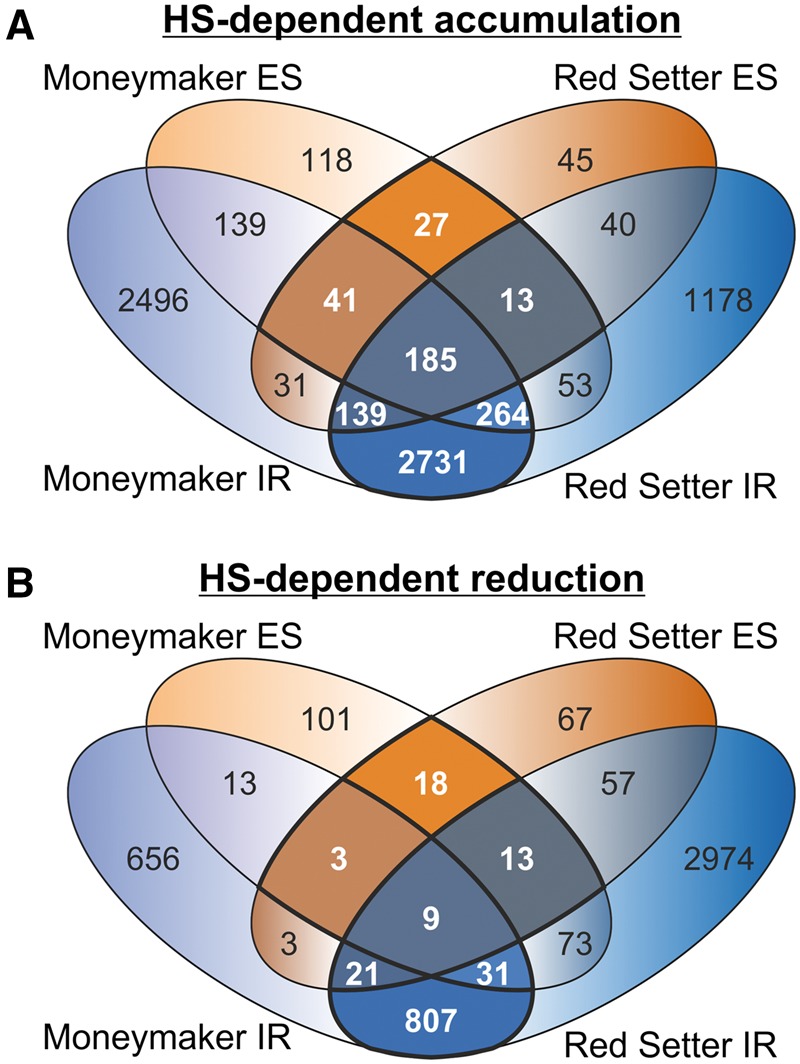
Figure 3.

Genes showing HS-dependent accumulation or reduction of AS in pollen. (A) and (B) display Venn diagrams representing the overlap of IR and ES containing genes showing HS-dependent accumulation (A) or reduction (B). Genes featuring IR (light and dark blue) and/or ES (light and dark orange) for the cultivars Moneymaker and Red Setter are shown. Numbers in white and bold lines indicate genes showing at least one common IR or ES event in both cultivars.
