Figure 2.
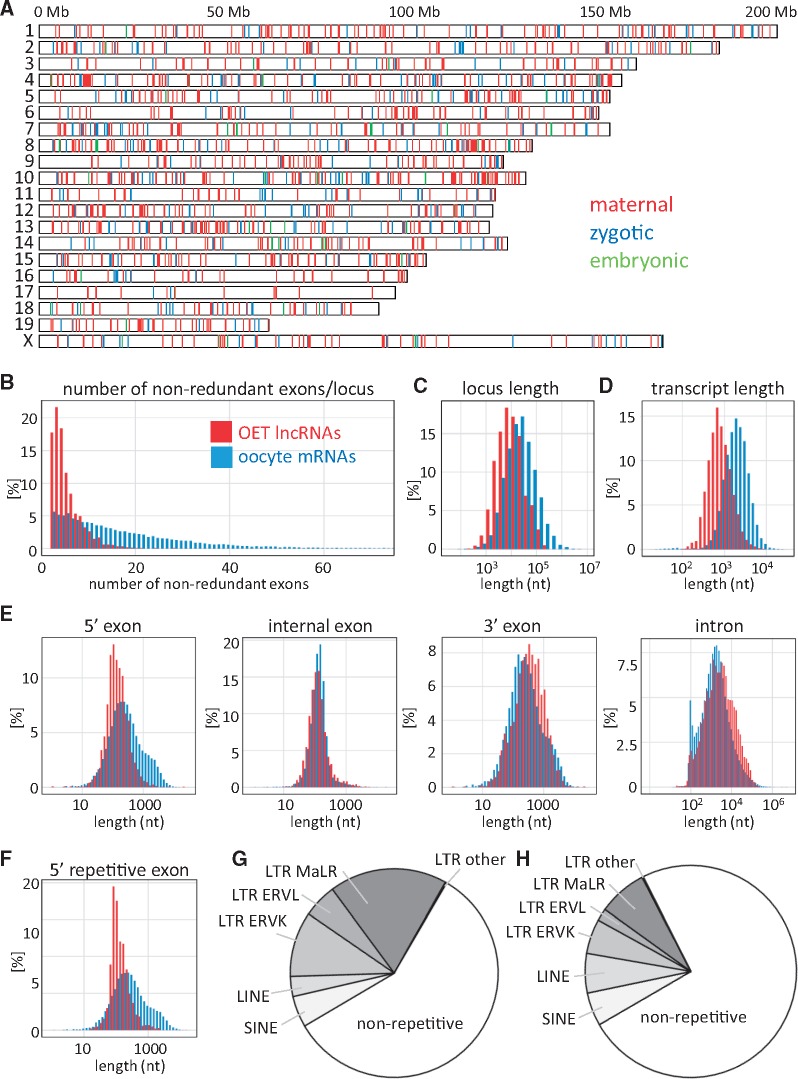
Structural features of OET lncRNAs. (A) Genomic distribution of 1,600 OET lncRNA loci across the mouse genome. The color-coding indicates the highest expression (maternal, GV oocyte or MII egg; zygotic, two- or four-cell stage; late preimplantation, morula or blastocyst). (B) Number of exons in OET lncRNAs; (C) OET lncRNA locus lengths; (D) Median transcript length produced from an OET lncRNA locus; (D) Length distribution of OET lncRNA exons and introns; (F) Distribution of LTR-derived first exon sequences. (B–F) All features of OET lncRNAs (depicted in red) are compared with oocyte mRNA data (depicted in blue). (G) Contribution of retrotransposons to OET lncRNA transcriptional regulation. The graph depicts fractions of 5′ OET lncRNA exons, which contain a given type of a repetitive sequence over the putative transcription start site and 50 bp upstream. (I) Contribution of repetitive sequences to mature (spliced) OET lncRNA sequences.

