
Figure 3.
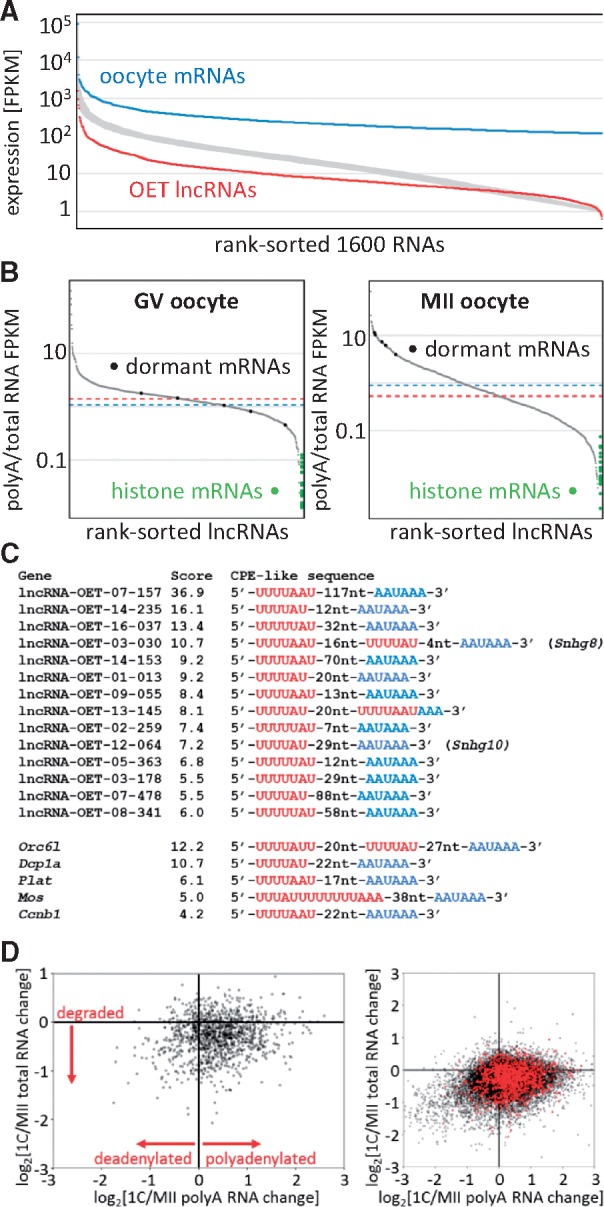
Expression features of OET lncRNAs. (A) Comparison of OET lncRNA expression levels with OET mRNAs. The Y axis shows log10 FPKM expression, the Y axis are rank-sorted RNAs as follows: blue, 1,600 most expressed maternal RNAs; red, 1,600 OET lncRNAs. The broad grey curve represents values for thousand random selections of 1,600 RNAs. The FPKM values were calculated as the maximum exon FPKM per cluster (B) Distribution of polyA scores in GV and MII oocytes. The Y axis depicts the polyA score calculated as the ratio of polyA NGS FPKM/total RNA FPKM. PolyA RNA data for GV oocytes were taken from the literature,31 for MII polyA RNA we used our own data (Supplementary Table S1). The X axis represents rank-sorted OET lncRNAs that had FPKM >0 (1131 for GV and 1273 for MII). Dashed red and blue lines represent median polyA score values for lncRNAs and mRNAs, respectively. Green points on the right site indicate polyA scores of histone mRNAS, black points on the curve indicate the rank of polyA scores of dormant maternal mRNAs. (C) Examples of putative CPE elements found among OET lncRNAs. (D) polyadenylation changes upon fertilization. The Y axis depicts relative changes of gene expression in total RNA upon fertilization (log2[1-cell/MII total RNA FPKM]), the X axis shows relative changes in polyA RNA (log2[1-cell/MII polyA FPKM]). The left scatterplot displays only OET lncRNAs, the right plot shows OET lncRNAs in red superimposed onto mRNAs (black). Each point represents expression of one gene.