
Figure 4.
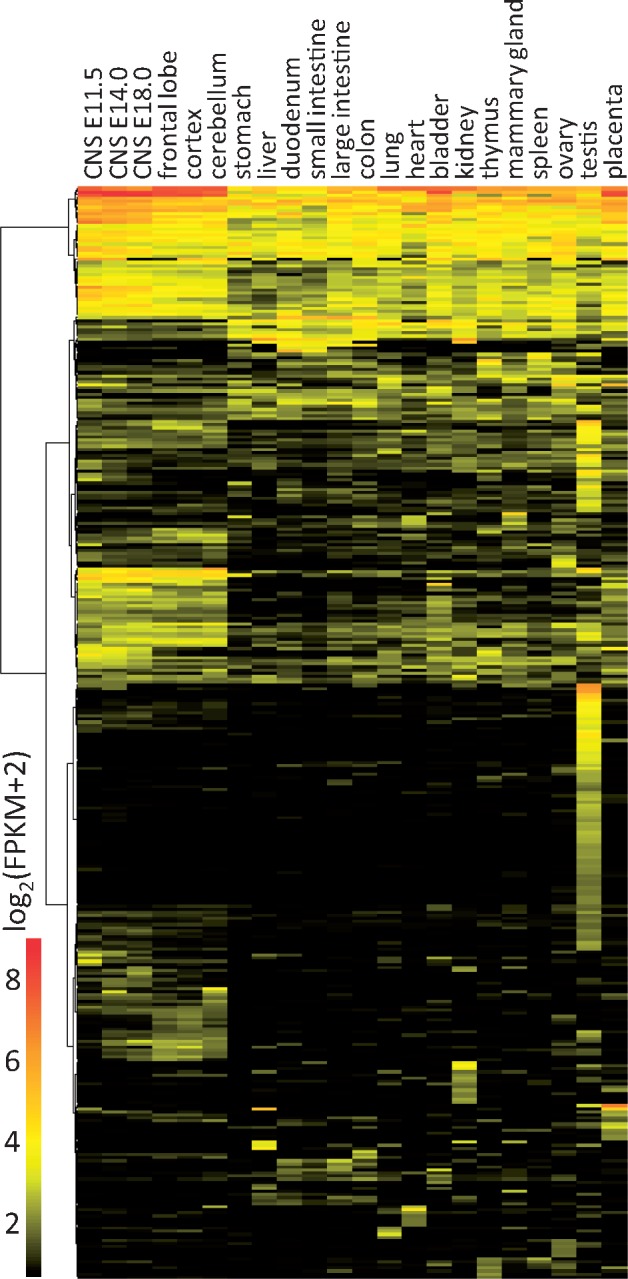
OET lncRNA expression in different tissues. The heatmap displays expression of 356 clusters with expression values >4 FPKM in at least one of 22 tissues selected from the ENCODE polyA RNA NGS mouse tissue panel (GSE49417 [37]).
Official websites use .gov
A
.gov website belongs to an official
government organization in the United States.
Secure .gov websites use HTTPS
A lock (
) or https:// means you've safely
connected to the .gov website. Share sensitive
information only on official, secure websites.
OET lncRNA expression in different tissues. The heatmap displays expression of 356 clusters with expression values >4 FPKM in at least one of 22 tissues selected from the ENCODE polyA RNA NGS mouse tissue panel (GSE49417 [37]).